Hello Huys
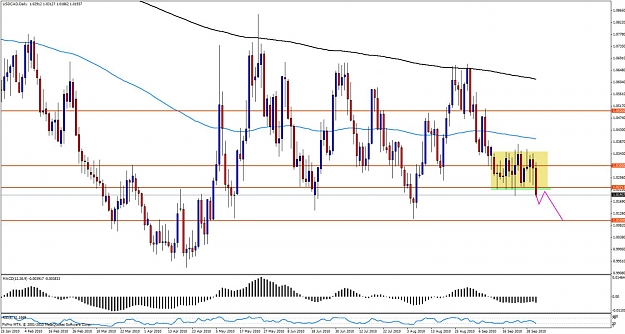
The USD/CAD is on the lower end of the range and maybe we could see a breakout or it may just consolidate, or form a pinbar at lower part of the range.
Maybe it could be a good trade for next week. Like to get comments on this from senior members like Mike, Jaroo, Pinbar and many others.( I apologize if I am missing someone)
According to me there is a high likelihood of a continuation of the downtrend. It is like the classic trendline break(which is not there on the following chart), then consolidation and then move in the direction...
Yes, you are wrong in as much as PINBAR is not a senior, just an earnest newbie.
I think this area is problematic, in as much as, a weekly bearish PB type bar just closed. It is not a valid bearish PB PA bar but it is a bearish bar by nature of the close. The close is sitting right on the RN. I think the area we are at on the daily with all those lows lining up is a possible flip area in the making. We want to see any bullish PA close above that area on the daily and any bearish PA come off it....
Ignored
I agree Pb .. .good analysis . . well done. . .
I like your chart of Price breaking out of this consolidation (yellow) and where Support turning into Resistance.
Attached Image (click to enlarge)
Indicators show the past. Price Action "Indicates" the future.
fxtsun
Do you see on the pic how the high is higher then the previous bar and the low lower then the previous low?
And the close of an BUOB mus´t be higher then the previous candle close
And the close of an BEOB mus´t be lower then the previous candle close
Hope it helps ;-)
So i go sleep its late here in germany good night ^^
Ignored
Thank you for the correction. Technically you are right, the last bar doesn't totally encompasses the prior bar, but it is a fine bearish bar nevertheless.
You have a good night and sleep well.
fxtsun
___________________________________
I need my conscience to keep watch over me
To protect me from myself- Brendan Perry
I like your chart of Price breaking out of this consolidation (yellow) and where Support turning into Resistance.
Ignored
Thanks Jarroo, just trying to help our on the weekend with not that many people around.
I have been thinking a lot about my former and not so distant, fixation with trying to find an indicator that draws PPZ reasonably well.
And, I have come to the conclusion that it is not possible because of the nature of PPZ. Maybe they can come close but it is really impossible.
Along with this, I have been thinking about the obsession I experienced with this search for the indicator.
Basically, I think it was a responsibility issues, meaning that if I used an indicator to draw PPZ and a trade failed because of it, I could then go "That @#@$$$# Indicator, $#@**($@@%$@$$@$$@$@!
This would then shift the blame for any failed setups not where it should be, on me, but on the indicator.
My suggestion is to just avoid that weekly pinbar.
Reasons:
1. Close is above the BRN 1.30000, should have been below.
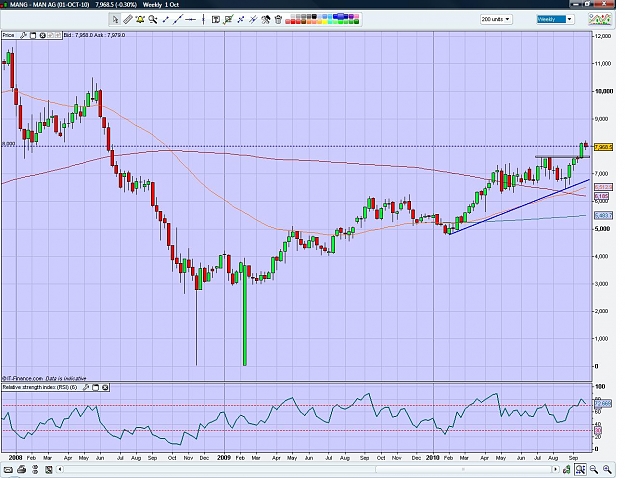
2. In the monthly chart, you can see the resistance is broken and there is a strong bullish bar. Price is obviously heading higher as continuation.
Attached Image (click to enlarge)
Anyways, if next week bar manages to close below that BRN, then it will be a much safer trade.
Thank you for the correction. Technically you are right, the last bar doesn't totally encompasses the prior bar, but it is a fine bearish bar nevertheless.
You have a good night and sleep well.
fxtsun
___________________________________
I need my conscience to keep watch over me To protect me from myself- Brendan Perry
Ignored
As john stated, it is not a BEOB technically.
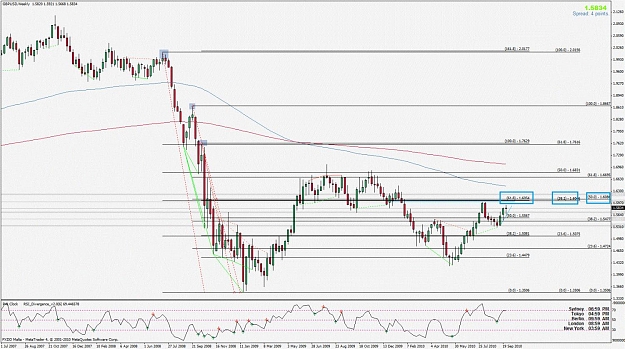
However, I concur with your view that it is a good bearish bar.. I would expect that it will retrace back to 1.3091- 1.3130
If it retraces back, I will be watching for a bearish PA on H4 to support daily bearish bar and weekly bearish pin.
This weekly pin is small and weak (long wic at the bottom) in relative to uptrend.. and not bounced off of 1.3300 in comparison to the weekly pin formed 04/04/2010.
My suggestion is to just avoid that weekly pinbar.
Reasons:
1. Close is above the BRN 1.30000, should have been below.
2. In the monthly chart, you can see the resistance is broken and there is a strong bullish bar. Price is obviously heading higher as continuation.
Anyways, if next week bar manages to close below that BRN, then it will be a much safer trade.
- Lord
Ignored
Good analysis.. I think you are right unless price closed below 1.3000 (VBRN), it may not be a safer trade.
My suggestion is to just avoid that weekly pinbar.
Reasons:
1. Close is above the BRN 1.30000, should have been below.
2. In the monthly chart, you can see the resistance is broken and there is a strong bullish bar. Price is obviously heading higher as continuation.
- Lord
Ignored
That's makes a lot of sense. I also think there is a "little" more bullish momentum.
This weekly pin is small and weak (long wic at the bottom) in relative to uptrend.. and not bounced off of 1.3300 in comparison to the weekly pin formed 04/04/2010.
Ignored
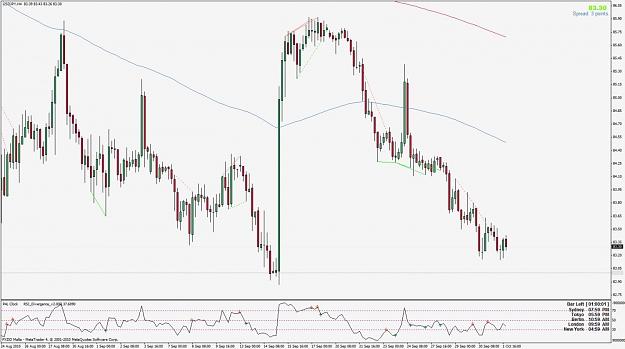
Yes I agree that it's smaller than the pin formed on 04/04/2010, but the reason this setup looks interesting to me is because the RSI shows a nice hidden divergence.
fxtsun
___________________________________ "Chance favours the prepared mind" - Louis Pasteur
IMHO if you are skeptical about setup - use half of your position size,,,,that helped me a lot to build confidence in my trading plan,,,,you got to have one,,,,less risk - easer to take a trade,,,,cause you never know....IMHO
That's makes a lot of sense. I also think there is a "little" more bullish momentum.
Yes I agree that it's smaller than the pin formed on 04/04/2010, but the reason this setup looks interesting to me is because the RSI shows a nice hidden divergence.
fxtsun
___________________________________ "Chance favours the prepared mind" - Louis Pasteur
IMHO if you are skeptical about setup - use half of your position size,,,,that helped me a lot to build confidence in my trading plan,,,,you got to have one,,,,less risk - easer to take a trade,,,,cause you never know....IMHO
Ignored
Yes I agree, kwikwis, that makes a lot of sense especially if trading the longer TF's where there are many pips involved.
fxtsun
___________________________________ "Chance favours the prepared mind" - Louis Pasteur
Of course! Actually, better than a pin, its a hammer (inverted).
Is there something I am missing? Looks fine for me.
Ignored
Ahh ok because I was under the impression that it wasn't protruding from the surrounding bars considering that the zone which the pin got rejected off also rejected a few bars just a while back.
That's makes a lot of sense. I also think there is a "little" more bullish momentum.
Yes I agree that it's smaller than the pin formed on 04/04/2010, but the reason this setup looks interesting to me is because the RSI shows a nice hidden divergence. ...
Ignored
(looking exclusively at your chart)
IMHO, an indicator divergence should Not be part of a trader's main reason to take a trade.
WHY? divergences get killed in strong trends.
divergence is part of the 'confluence' category, IMHO.
price may drop from here but i felt the need to point this out.
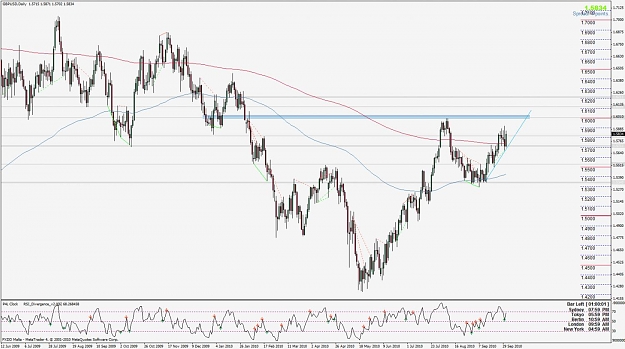
btw, u incorrectly plotted your RSI divergence. (im referring to the left part of the RSI div.; it does not correspond to the price div./ 4/4/2010 pin)
It is...but pretty insignificant if you're looking at it as a trading opportunity. Far too small (IMHO) vs a decent move up. Notice also that it wasn't exactly "off" the BRN was it? I mean clearly to me it's more of a bar that is indicating a pull back to the 1.4 after that close above the level.
This is not the first time I've said it...but a price bar even a J16 one is a single page of a thick interesting, thrilling and exciting novel. No matter how attractive the text on the page looks it has little value to offer if you read it in isolation to the text on the many pages before and after it.