Thank you for letting me know your view of consolidation. But when you say more concrete.. is it close to 20 bars or so ? I am just trying to get some quantitative aspect to start with.. though this alone may not drive the trade.
Ignored
Hey C
It is not an exact number of bars for me, it is the look of the pattern on the chart in relation to what else is going on.
fxtsun
Do you see on the pic how the high is higher then the previous bar and the low lower then the previous low?
And the close of an BUOB mus´t be higher then the previous candle close
And the close of an BEOB mus´t be lower then the previous candle close
Hope it helps ;-)
So i go sleep its late here in germany good night ^^
Ignored
Hey guys just to correct a bit. This is something I personally do with my outside bars, but an outside bar does not have to close above the previous high/low, it simply should be near the end(I prefer it to close outside though).
Not to be a party spolier, but it makes me wonder why indecision alone should be enough a signal to go short?
g.
Ignored
Well lemme explain a little more in detail, in the attachement you'll see Adidas reaching the RNB @ 4600 in may 2009 via a bullish bar with a lot of momentum, but the week after that this bullish momentum completely dissipated via a indecision bar and price entered into a consolidation zone rougly between the RNB's 4400 & 4600. The question was then are we going higher than 4600 or are we going lower than 4400, during this period the difference between supply and demand is at a minimum. Then mid june 2009 price breaks rapidly out of the consolidation zone to the downside due to a large imbalance in the supply/demand equation, supply exceeds demand heavily withnessed by the large red bars. In the second week of august we see a pullback to the previous consolidation zone support @ 4400, which was beautifully rejected via a PB. Price now has revisited this level again and broke this level via a large bullish bar, but bullish momentum dissipated the next week reflected via a small indecision bar closing below the RNB @ 4600 (also the range resistance back in 2009). Because the barrier @ 4600 is to strong to be taken out for the moment, this would be a nice oppertunity for the bulls to catch their breath and to revisit the broken resistance @ 4400 to test it as support which it hasn't done that yet. So these are my thoughts behind my previous post, I didn't want to make you guys yawn so didn't write this down in the post.
(looking exclusively at your chart)
IMHO, an indicator divergence should Not be part of a trader's main reason to take a trade.
WHY? divergences get killed in strong trends.
Ignored
I strongly disagree with you. It should definitely be one of the main reasons to enter a trade in my opinion, but not the main one.
btw, u incorrectly plotted your RSI divergence. (im referring to the left part of the RSI div.; it does not correspond to the price div./ 4/4/2010 pin)
Ignored
Here I'm attaching a new chart so perhaps you will see better. You simply cannot ignore it.
fxtsun
___________________________________ "Chance favours the prepared mind" - Louis Pasteur
This is not the first time I've said it...but a price bar even a J16 one is a single page of a thick interesting, thrilling and exciting novel. No matter how attractive the text on the page looks it has little value to offer if you read it in isolation to the text on the many pages before and after it.
g.
Ignored
Yes. I did read similar comments about reading the price actions (before and after) as a whole book rather than a single page (specific to one bar).
I am realizing that this is the toughest part which comes with experience.
When I noticed the bar, Yes, I did see the uptrend with couple of big vertical bars .. coming from 1.25 (retraced to 1.30 when reached to 1.37). However the overall trend is still down all the way coming from 1.75.
Then 1.4100 is acted as a great resistance on weekly chart. In this context
IPB looks to me as if bears have stepped in since it coulld not clear 1.4100.
It is...but pretty insignificant if you're looking at it as a trading opportunity. Far too small (IMHO) vs a decent move up. Notice also that it wasn't exactly "off" the BRN was it? I mean clearly to me it's more of a bar that is indicating a pull back to the 1.4 after that close above the level.
This is not the first time I've said it...but a price bar even a J16 one is a single page of a thick interesting, thrilling and exciting novel. No matter how attractive the text on the page looks it has little value to offer if you read it in...
Ignored
Hi Ghous,
I was also looking at this pair. But my thoughts were to put a sell order at around 1.3990 (below the 1.4) so that if price breaks below the 1.4, it should hit the FTA of about 1.3940 for a quick profit of 50 pips. Any comments on this?
What do you mean here ? It is off of the 1.4000 BRN and stopped below 1.4100 BRN.
That's what it did.
Yes. I did read similar comments about reading the price actions (before and after) as a whole book rather than a single page (specific to one bar).
I am realizing that this is the toughest part which comes with experience.
When I noticed the bar, Yes, I did see the uptrend with couple of big vertical bars .. coming from 1.25 (retraced to 1.30 when reached to 1.37)....
Ignored
When we refer to a setup as being "off a round number" in terms of location and confluence it basically implies that we are wanting to use the logical supp/res at and around the level to our advantage, that is we have the added edge of having a well protected stop.
It is hence important that a PA bar may it be an IPB or a regular PB or an outside bar - it has to be off a round number and/or ppz in a way that it protects your stop well rather than just "occur" at it.
The EUR/CAD IPB closed above the 1.4 and the bar did "occur" at the 1.4 though obviously that isn't contributing in a positive way to your trade management/entry/exit decisions. In fact, since price closed above 1.4 one can not be surprised if price finds support at the RN and bounces off to take you out - so in reality the close being above the 1.4 is a negative that outweighs the blunt advantage of "being at the 1.4 either ways"
I was also looking at this pair. But my thoughts were to put a sell order at around 1.3990 (below the 1.4) so that if price breaks below the 1.4, it should hit the FTA of about 1.3940 for a quick profit of 50 pips. Any comments on this?
Well lemme explain a little more in detail, in the attachement you'll see Adidas reaching the RNB @ 4600 in may 2009 via a bullish bar with a lot of momentum, but the week after that this bullish momentum completely dissipated via a indecision bar and price entered into a consolidation zone rougly between the RNB's 4400 & 4600. The question was then are we going higher than 4600 or are we going lower than 4400, during this period the difference between supply and demand is at a minimum. Then mid june 2009 price breaks rapidly out of the consolidation...
Ignored
Interesting,
I do play indecision bars (occasionally) myself but that's when they point towards the continuation of a strong trend and occur on weak pull backs. Wanted to know your thought process when playing them at swings and genuinely against the current.
Yes, you are wrong in as much as PINBAR is not a senior, just an earnest newbie.
I think this area is problematic, in as much as, a weekly bearish PB type bar just closed. It is not a valid bearish PB PA bar but it is a bearish bar by nature of the close. The close is sitting right on the RN. I think the area we are at on the daily with all those lows lining up is a possible flip area in the making. We want to see any bullish PA close above that area on the daily and any bearish PA come off...
Ignored
Thanks to both Pinbar and Jarroo for their kind reply. Hope it happens the way we expect it to and wait for a price action confirmation to give us the way.
I do play indecision bars (occasionally) myself but that's when they point towards the continuation of a strong trend and occur on weak pull backs. Wanted to know your thought process when playing them at swings and genuinely against the current.
Thank you.
g.
Ignored
You're welcome G. I should have made my thought process more clearer right at the start as SC suggested.
(looking exclusively at your chart)
IMHO, an indicator divergence should Not be part of a trader's main reason to take a trade.
WHY? divergences get killed in strong trends.
divergence is part of the 'confluence' category, IMHO.
price may drop from here but i felt the need to point this out.
btw, u incorrectly plotted your RSI divergence. (im referring to the left part of the RSI div.; it does not correspond to the price div./ 4/4/2010 pin)
Ignored
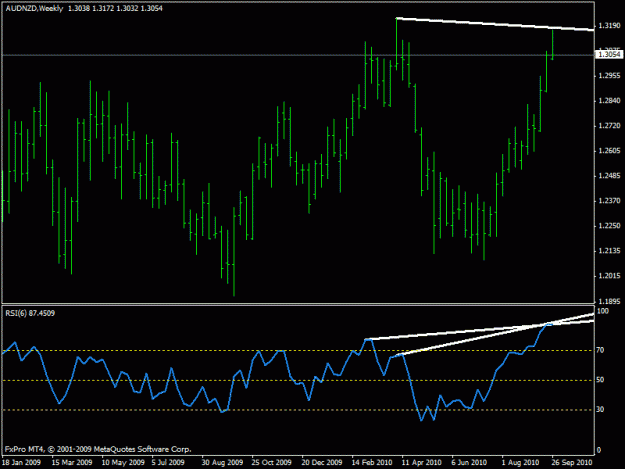
There is another commonly made mistake when drawing divergence between an indicator and price: the definition of divergence involves plotting a line between well defined swing highs or swing lows. In the posted weekly chart of A-N, we see that the second contact point consists of the PB-high, but this isn't a well defined swing point YET, it is a swing high only when the next weekly bar closes with a high lower than the PB-high. A well defined swing high is a 3 bar pattern where the middle bar has the highest high. The first contact point is a well defined swing high. Also look at the second contact point of the RSI, this should be a local maximum (mathematically stated: the derivative of the RSI should be zero at the second contact point) but look at the RSI at the second contact point it is still rising more or less and hasn't made a local maximum yet. So if you want to apply divergence then do it accurately.
Hello Mike
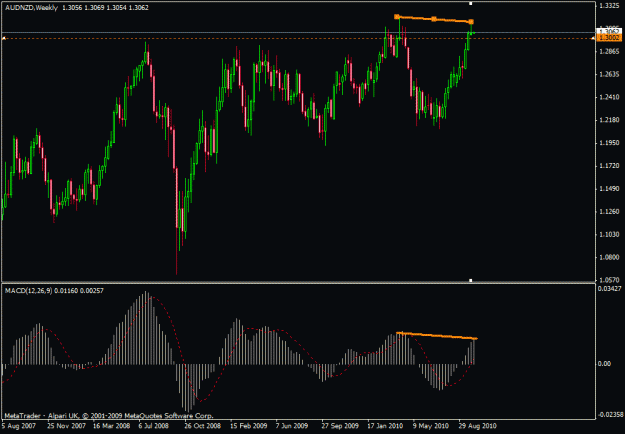
I am currently watching a good short opportunity on this pair. It is on its all time high PPZ, and there is a divergence in MACD on the weekly and a pibar on weekly and there is also some sort of triple bar high low close on daily. But i am circumspect in taking it until it crosses 1.30 BRN. Would like you to see it and present your opinion. It would be very beneficent.
Regards
Maarc
Hello Mike
I am currently watching a good short opportunity on this pair. It is on its all time high PPZ, and there is also a divergence in MACD on the weekly and there is also some sort of triple bar high low close. But i am circumspect in taking it until it crosses 1.30 BRN. Would like you to see it and present your opinion. It would be very beneficent.
Regards
Maarc
Ignored
Hey Maarc
There is no divg on my MACD as both price is sloping down as well as the MACD. I see a very weak closing small pin towards previous resistance. TO me this is reactionary as opposed to true strength and there is a ton of support below. I would not touch this one based on that signal at all. Need to see something more concrete before fighting the recent uptrend. Daily is nothing more then a bearish day on a friday, so not much more there either. I would wait to see price get up higher.
There is no divg on my MACD as both price is sloping down as well as the MACD. I see a very weak closing small pin towards previous resistance. TO me this is reactionary as opposed to true strength and there is a ton of support below. I would not touch this one based on that signal at all. Need to see something more concrete before fighting the recent uptrend. Daily is nothing more then a bearish day on a friday, so not much more there either. I would wait to see price get up higher.