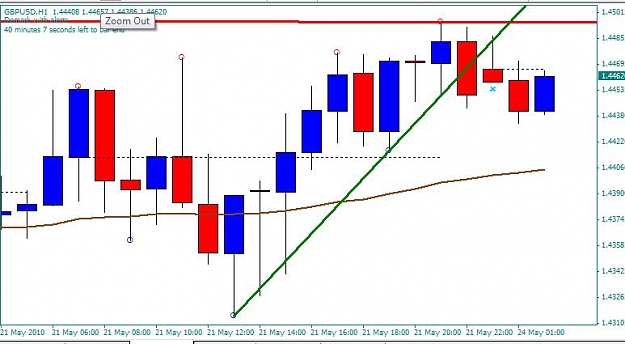
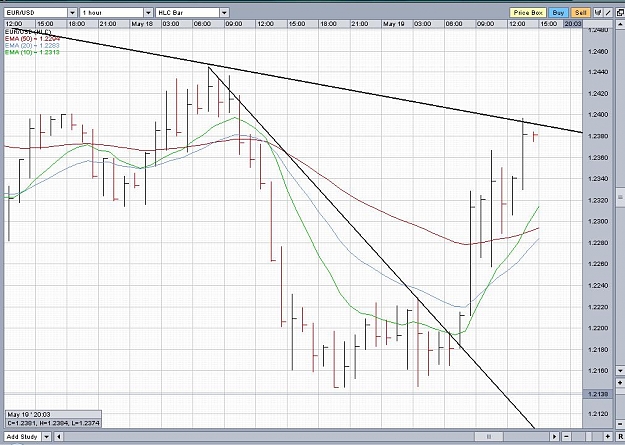
Great price action charts. Has similarities to this thread: http://www.forexfactory.com/showthre...?t=2331&page=3
Please code "Parabol trendline" or "Curve trendline" for me 0 replies
Trendline, Trendline and Trendline 4 replies
Trading Breakouts in FX market, by Sam Shenker 5 replies
Confirming Trendline breaks, chart patterns and other breakouts. 2 replies
Breakouts 3 replies
DislikedIt has been an interesting few weeks since this thread has started. I enjoy the experience of having my own thread.
Although I think it has not been that popular a thread, I hope that it has helped some to understand the concept of using trendlines as support/resistance, to delineate a 'line in the sand' between uptrends and downtrends.
With that, this will be my last post for a while at least.
Cheers to allIgnored
DislikedI offer the following by way of critique of commonly held TA assumptions that everybody takes for granted and not as a critique of your efforts. Please carry on.
Common TA assumptions should be scrutinized by anybody who wants to trade with the probabilities. Ask the following question, how can 2 or 3 data points determine a trend? What about all the other data points - are they less significant than the ones that are cherry picked for trend line drawing? How about another question, why must a trend line be a straight line?
There are...Ignored
DislikedI will address your question.
How can 2 or 3 data points determine a trend?
ANS: Well, the minimum you need to determine a trend are two data points. You cannot use one data point. You need at least two. This is mathematics. Now, for a given sample size, two may or may not be enough. It all depends on what you are looking for, what function you are using to plot these two data points together, what is the statistics noise level, etc. But just because you have two data points doesnt mean it is meaningless.
Also, the presupposition that you have...Ignored
DislikedVery good answers, well done.
As prices derived from the auction process (market) are the end result of supply and demand form market participants, there is an inherent randomness and hence madness to market prices. By using assumptions and orderly structures such as trendlines and TA, one can get (hopefully) a more cognisant picture on which to make buy and sell decisions.Ignored
DislikedEMARCO,
Is this you? This person on youtube use a strikingly similar system to yours.
http://www.youtube.com/watch?v=mY2pA85dAEQIgnored
Dislikedhi emacro
how do you know which direction to draw the trendline in order for it to break up or down? does it matter? do you consider larger timeframes when you draw your trendlines? when i look at your charts it looks so obvious but when i look at mine i dont know where to start!Ignored