Setups/breakouts i am looking forward to.
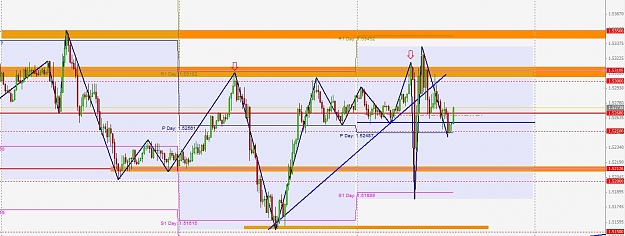
AUD/CAD breakout. weekly and daily chart.
The breakout of that triangle/pennant will be nice.
AUD/CAD breakout. weekly and daily chart.
The breakout of that triangle/pennant will be nice.
Attached Image(s) (click to enlarge)