• Home
  • Forums
  • Trades
  • News
  • Calendar
  • Market
  • Brokers
  • Login
  • Join
  • User/Email: Password:
  • 5:34am
Menu
  • Forums
  • Trades
  • News
  • Calendar
  • Market
  • Brokers
  • Login
  • Join
  • 5:34am
Sister Sites
  • Metals Mine
  • Energy EXCH
  • Crypto Craft

Options

Bookmark Thread

First Page First Unread Last Page Last Post

Print Thread

Similar Threads

The System Behind the System, by Merlin Jeffries 16 replies

Sonic R.evolution 93 replies

Old School Sonic System + Other Things 11 replies

Knife system, Vegas 4h system related questions. 4 replies

Would you trade this system? New system #2. 10 replies

  • Commercial Content
  • /
  • Reply to Thread
  • Subscribe
  • 51,111
Attachments: Sonic R. System
Exit Attachments
Tags: Sonic R. System
Cancel

Sonic R. System

  • Last Post
  •  
  • 1 676677Page 678679680 4160
  • 1 Page 678 4160
  •  
  • Post #13,541
  • Quote
  • Edited 3:28pm Jul 16, 2010 3:00pm | Edited 3:28pm
  •  traderathome
  • Joined Mar 2008 | Status: PVSRA with Traderathome | 22,914 Posts
A Word About Technicals:

Except for one, every technical there ever was, is, or will be is based on price......They are all derived from some mathematical screwing around with the price itself. They just "convert" the picture of the waves created by the price, into some other picture with the intent of making something more recognizable. And then users of these technicals make the "leap of faith" and start using them as "predictors"!

No one knows where the price will be a day hence, or an hour hence, or even a few minutes hence.....except maybe the profs when they are engaged in, or about to engage in, a price drive one way or the other. All that the tecnicals accomplish is to "weaken the muscles" that allow you to see PA for what it really is, and to make you ever more dependent on the technicals themselves.....a plan for disaster.

Any experienced trader that has used much of the basketfull of technicals at one time or another, will tell you of the many times they failed as price soared or dived far and totally contrary to what the technicals "predicted". And they will tell you of the "revelation" they had afterwards, looking at the price chart alone, saying to themselves "Gee, I could never have known in advance this was going to happen, (no one could have) but once it started I should have seen its potential!"

I can hear ddaytrader saying, "Clear the chart of everything but the candles and the Dragon. Then learn to trade SonicR the pure and successful way. Learn to recognize the good waves we trade. Learn to see from the PA track itself, the past clues as to future targets."

The ONLY technical that is NOT based on price is VOLUME! Unfortunately, forex liquidity/data providers give out just the volume of trades on their individual system/server. It is not market wide data, nor does it disclose the size of the trades. This can be very misleading, therefore. Here is an example....

You see a very tall candle reach upwards, then another! You see the "volume" bigger than previous TFs and growing. And you think to yourself there is a lot of buying going on! In reality, the drive up in price is manipulated.....some outfit is supplying/taking out every order up to their desired price target, investing whatever monies is required to do so. And at their price target they already have a sell order sitting....for BILLIONS! And when their single huge order is filled it is during a very small "volume" bar, because very few trades happened to take place at that very highest pip of the run!

Yes, that could happen. Perhaps the example employs some exaggeration, but only what was necessary to get the point across.

There is one feature of forex "volume" that is valid, however. That is the RELATIVE INCREASE/DECREASE in activity that happens from time to time. It is a harbinger of something to come, because it says traders are flocking in/or not......for some reason. It does not say which way the price will be going, nor when. It provides a clue, that is all.

We all need to learn to read PA....good waves from no waves and from bad waves, and where are S&R and consolidation levels. PA is a pure technical. It is the only pure technical. And if there is any technical that might "add" something to the skill of reading PA, it might be NVO, because "volume", even just trade counts, is the only other technical NOT BASED on PA. And NVO is unique in that it most clearly shows the only characteristic of forex volume that is valid.....relative increases/decreases in the amount of trading occurring. At certain times during the market day, such information may become more important than at other times. And when trading relatively increases at those certain times, and at significant points in the creation of PA waves, then we do have a separate clue.

Congratulations to all who made succesful SonicR trades this week, and/or who managed their SonicR trades successfully to mimimize losses.

Good trading to all next week!

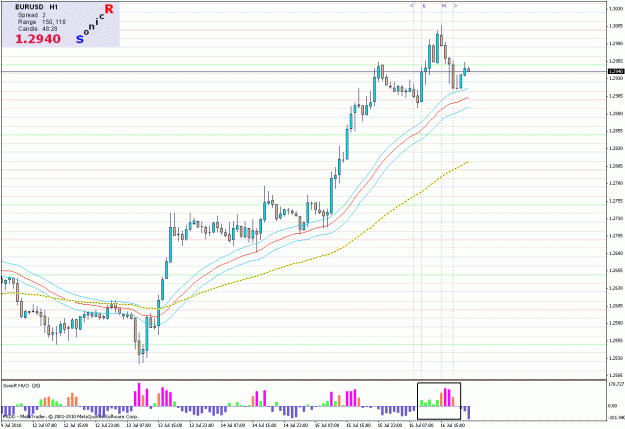
P.S. The attached pics show interesting situations. With EU, PA reached and failed at a whole number high. Overall PA in that area is beginning to take on the look of a possible future Head and shoulders. Meanwhile, the NVO study shows inceased trading as the prof drove the price to its final high.....and even more trading on the first leg down off that high! With EJ, PA broke lower TL and has come up to retest it. Look at the NVO activity on the first leg off the highs that broke the TL. With either pair, such activity mkes one wonder if next week will start with a gap down.
Attached Image(s) (click to enlarge)
Click to Enlarge

Name: # 774.gif
Size: 29 KB
Click to Enlarge

Name: # 775.gif
Size: 32 KB
 
 
  • Post #13,542
  • Quote
  • Jul 16, 2010 3:05pm Jul 16, 2010 3:05pm
  •  traderathome
  • Joined Mar 2008 | Status: PVSRA with Traderathome | 22,914 Posts
Quoting KumoDragon
Disliked
I think I'll keep all those indies as they are part of the rules in the manual. I use the shi for the H1 bias. I feel they are useful. The corbra indicator was in the group I downloaded from the sonic thread. So, it's not something I added on.

I've already been trading long enough to map s&r areas manually, but since I'm watching multiple pairs the indicators make it easier. They point out the areas for me, so I dont have to manually map them out. (And possible get confused going through multiple pairs) So, why wouldn't I just use the indicators...
Ignored
First you complain about something in the indys that is sucking up computer resources, and ask what is wrong. I give you the answer. Then you say you are going to keep things as they are.

Ok.

Just next time, don't complain about something you have no intention of changing!
 
 
  • Post #13,543
  • Quote
  • Jul 16, 2010 3:34pm Jul 16, 2010 3:34pm
  •  KumoDragon
  • | Joined Sep 2009 | Status: Member | 1,048 Posts
Quoting traderathome
Disliked
First you complain about something in the indys that is sucking up computer resources, and ask what is wrong. I give you the answer. Then you say you are going to keep things as they are.

Ok.

Just next time, don't complain about something you have no intention of changing!
Ignored
Well, I wasn't complaining about the indicator function or use of it, just how it bogging down the comp.

As long as I know which one it is I can at least take it off pairs that dont have a set up and put it back up when I need it so my comp runs fine.
 
 
  • Post #13,544
  • Quote
  • Jul 16, 2010 3:38pm Jul 16, 2010 3:38pm
  •  KumoDragon
  • | Joined Sep 2009 | Status: Member | 1,048 Posts
Quoting traderathome
Disliked
A Word About Technicals:

Except for one, every technical there ever was, is, or will be is based on price......They are all derived from some mathematical screwing around with the price itself. They just "convert" the picture of the waves created by the price, into some other picture with the intent of making something more recognizable. And then users of these technicals make the "leap of faith" and start using them as "predictors"!

No one knows where the price will be a day hence, or an hour hence, or even a few minutes hence.....except...
Ignored
On this note, I want to find more information/study material on wave analysis. Can you point me to some.
 
 
  • Post #13,545
  • Quote
  • Jul 16, 2010 3:54pm Jul 16, 2010 3:54pm
  •  traderathome
  • Joined Mar 2008 | Status: PVSRA with Traderathome | 22,914 Posts
Quoting KumoDragon
Disliked
On this note, I want to find more information/study material on wave analysis. Can you point me to some.
Ignored
If you Google "Wave Analysis" you will probably get a lot of sites that delve into one kind or another of mathematical anaylsis of waves, KumoDragon. I am thinking of such things as Wolfe Wave Analysis, etc.

While all that stuff may be entertaining, it is not the kind of PA wave reading that is SonicR. And so I can only refer you to this thread, and the posted charts of successful pure SonicR method trades. Such posters to look for are Sonic himself, ddaytrader, Domas4, Muhammad989 and DanPa.

Scan for their posted trades, and study and reflect on any waves leading up to their trades, as shown in their charts. Two things will eventually start to become more clear.

1. How waves should look leading into a SonicR setup.

2. How poster's charts should look if they are to be instructional to others in the future.
 
 
  • Post #13,546
  • Quote
  • Jul 16, 2010 4:07pm Jul 16, 2010 4:07pm
  •  Eynshteyn
  • | Commercial Member | Joined Jul 2009 | 87 Posts
Quoting traderathome
Disliked
GU Short Trade Opened and Closed:

Entered short below SonicR EP area because I wanted price first to break what I believed to be a support area (blue line and central pivot, too). So entry was made during heavy consolidation below the central pivot. I placed SL at upper level of the Dragon high. I placed TP in area of perceived SR below (lowest blue line).

Trade yielded 65 pips profit.
Ignored
how to display levels MR1, DPV, MS1, DS1. Thanks
 
 
  • Post #13,547
  • Quote
  • Jul 16, 2010 4:21pm Jul 16, 2010 4:21pm
  •  traderathome
  • Joined Mar 2008 | Status: PVSRA with Traderathome | 22,914 Posts
Quoting Eynshteyn
Disliked
how to display levels MR1, DPV, MS1, DS1. Thanks
Ignored
I can't figure out if you are asking a question, or not. Maybe you are just thanking me for cluing you in on using pivots.

But, in case you are asking a question, you just got the answer.
 
 
  • Post #13,548
  • Quote
  • Jul 16, 2010 4:30pm Jul 16, 2010 4:30pm
  •  Eynshteyn
  • | Commercial Member | Joined Jul 2009 | 87 Posts
Quoting traderathome
Disliked
I can't figure out if you are asking a question, or not. Maybe you are just thanking me for cluing you in on using pivots.

But, in case you are asking a question, you just got the answer.
Ignored
Sorry my English is terrible. Yes, I asked how to display them on screen.
You wrote that created new indicators, which differ from the assembly 05-18-2010
 
 
  • Post #13,549
  • Quote
  • Jul 16, 2010 5:12pm Jul 16, 2010 5:12pm
  •  traderathome
  • Joined Mar 2008 | Status: PVSRA with Traderathome | 22,914 Posts
Quoting Eynshteyn
Disliked
Sorry my English is terrible. Yes, I asked how to display them on screen.
You wrote that created new indicators, which differ from the assembly 05-18-2010
Ignored
Currently in-work is a template simiilar to the previous, but with upgraded indicators. Using and posting them is just part of my field testing before I turn the package over to Sonicdeejay for his review and possible approval and inclusion on page #1, post #1 as an approved SonicR zip file.

Meanwhile,if you want pivots, the latest SonicRV3 zip file in post #1 contains a pivot indicator, which I am surprised you don't already know about. Also, this week someone else asked about the TzPivotsD indicator, which is similar to the upgrade I am working on. I replied with a post containing the url for that indy, as well as some instructions useful to adapting it to our template. You have been here over a week, so I am surprised that you don't know about all this also.

Anyway, for now either use the pivot indy in the SonicRV3 zip file, or read back to the discussion on the TzPiovtsD indy and download and use it.
 
 
  • Post #13,550
  • Quote
  • Jul 17, 2010 3:12am Jul 17, 2010 3:12am
  •  tradernoob
  • | Joined Jul 2010 | Status: Member | 4 Posts
Now that is weekend, i think its time to introduce myself and thank a few people here for their work! I know its a little late for my introduction, but i tried to read the postings and there are many here, lol.

i am a part time trader (4 hours a day) and i am trading live for 3 years now. i had good months and i had bad months, but with this system my ratio is getting much better!
I am trading this system just for 2 weeks live and the results are excellent!

Thanks for your work sonicdeejay, traderathome and kumodragon.
By posting several times a day you offer a great live tutorial for this system. This saved me a lot of money!
 
 
  • Post #13,551
  • Quote
  • Jul 17, 2010 11:38am Jul 17, 2010 11:38am
  •  KumoDragon
  • | Joined Sep 2009 | Status: Member | 1,048 Posts
Quoting tradernoob
Disliked
Now that is weekend, i think its time to introduce myself and thank a few people here for their work! I know its a little late for my introduction, but i tried to read the postings and there are many here, lol.

i am a part time trader (4 hours a day) and i am trading live for 3 years now. i had good months and i had bad months, but with this system my ratio is getting much better!
I am trading this system just for 2 weeks live and the results are excellent!

Thanks for your work sonicdeejay, traderathome and kumodragon.
By posting several times...
Ignored
Keep in mind I'm just as new to sonic as you are. I am posting my trades to help, but it doesn't mean I'm a sonic expert or anything like that.

So, far the trades seem to work out well if you follow the rules and be patient enough to only trade good set ups. (I screwed up a couple of trades by not doing that initially) But, I havn't had enough sonic trades to have a proper sample size and thus work out what the overall win/loss ratio and possible equity curve would be. Though all my trades with it thus far have been live and not demo.

I'm giving it ago because of all the postive set ups posted throughout this thread and because looking at past charts it looks to have good potential going forward.

Also, the method is not complicated, but is based things that work well in the market. (wave analysis, ema's, support and resistance, trend)
 
 
  • Post #13,552
  • Quote
  • Jul 17, 2010 11:41am Jul 17, 2010 11:41am
  •  KumoDragon
  • | Joined Sep 2009 | Status: Member | 1,048 Posts
My borker recently added pippetts. Is there anything in any of the indicator settings I need to change?
 
 
  • Post #13,553
  • Quote
  • Jul 17, 2010 5:29pm Jul 17, 2010 5:29pm
  •  Basber
  • Joined Feb 2009 | Status: Member | 1,292 Posts
Quoting KumoDragon
Disliked
Ok now I'm really confused the market hours calender at babypips says london open is 8:00 (eight hundred )
Ignored
Hi KD,

If you still got problems calculating timezones, then here's a program that shows different countries/cities time. No need to adjust anything, It'll automaticly change what ever it needs to. just run it.

Regards,
Basber
Attached File(s)
File Type: zip QLock.zip   710 KB | 615 downloads
Trading methods are designed to put the odds in our favor, not predicting.
 
 
  • Post #13,554
  • Quote
  • Edited Jul 18, 2010 10:39am Jul 17, 2010 6:14pm | Edited Jul 18, 2010 10:39am
  •  fxbr56
  • | Joined Jul 2010 | Status: Member | 42 Posts
Attachment 509845Hello SonicR's. I feel I know you, as I've been reading your many posts for the past 2 weeks. This is my first post and contribution. Hopefully I'll be able to contribute to your efforts and you to mine.

I'm a part-time trader and am trading with the SonicR system exclusively. I've tried trading before with a variety of different methods and techniques, but haven't had the consistent success I've seen with using the SonicR system.

Thanks for all your posts and instructions. I've written a little Excel spreadsheet (for those with MS Excel) that calculates Lot Size and Risk/Reward ratio. Let me know what you think about it and if there's anything else I can put into a spreadsheet, let me know.
Attached File(s)
File Type: zip Lot Size Calculator and Risk Reward Calculator.zip   6 KB | 560 downloads
 
 
  • Post #13,555
  • Quote
  • Jul 17, 2010 8:33pm Jul 17, 2010 8:33pm
  •  wh1zz0
  • Joined Aug 2008 | Status: *Sic Parvis Magna* | 838 Posts
Quoting traderathome
Disliked
[font=Times New Roman][size=3]Presented herewith is a template for trading SonicR, including supporting indicators. In three respects, this is different from existing templates: session range H/L lines can be shown on the chart, so can vertical time lines marking the SonicR approved trading hours, and consistent price levels are used instead of pivots. A summary of the 7 supporting indicators follows. I recommend that you read the very important user notes I have included in the compile of each, to better understand the features provided not mentioned...
Ignored
Hello TAH, Sonic, and all traders here,

I was looking for a really nice Range indicator which has inbuilt session times within it and I was lucky to have come across yours after about 1 hour of searching. I just want to say thank you so much for this as it surpassed my expectation of what I hoped to find. Even though I do not trade your system, I really find the Market Range Display Indicator VERY useful and so decided to say THANK YOU. The amazing thing about this indicator which differs from the rest out there is that all the timezones listed on it are in "real time".

Thanks once again for sharing this.

Cheers and good luck with your trading.
 
 
  • Post #13,556
  • Quote
  • Jul 17, 2010 11:56pm Jul 17, 2010 11:56pm
  •  sonicdeejay
  • | Commercial Member | Joined Mar 2008 | 9,228 Posts
Guys...

Sonic R and Sonic R V2 re-uploaded..


Sonic
Attached File(s)
File Type: zip SonicR.zip   57 KB | 816 downloads
File Type: zip SonicRV2.zip   23 KB | 795 downloads
 
 
  • Post #13,557
  • Quote
  • Edited 11:50am Jul 18, 2010 4:46am | Edited 11:50am
  •  Pumlitch
  • | Joined Jun 2010 | Status: Master of The Black Degree | 348 Posts
Quoting traderathome
Disliked
EU Short Trade Upate:

Trade is still running. PA is currently at a SonicR EP zone for a new short trade, but in the red over 60 pips based on the final average for the 5 individual short entries. The SL and TP are not active ones. They will be reset next week.

By the time PA retraces to where this trade started, the trade will be up over 150 pips.
Ignored
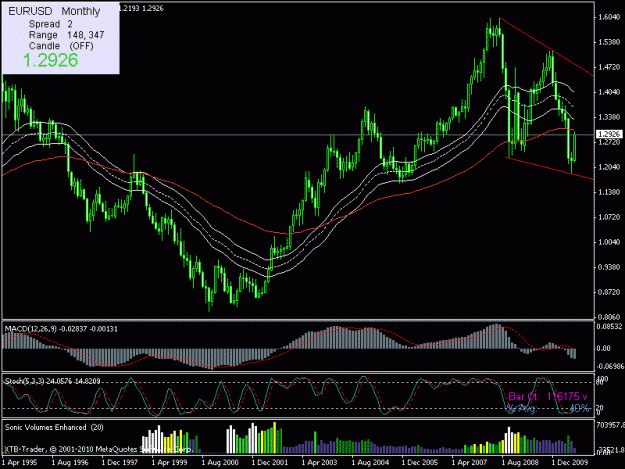
I would preffer PA move to upper TL as indicated on the picture, but it is still only pressuming (pressuming is what I don't like in trading). Anyway, the MN view is so huge TF that it looks almost irrelevant. Sure, the next shorter timeframe move looks like a possible downtrend for 100-200pips.

After a week of holiday in our cottage by a lake I am fresh to earn some pips if I will survive monday company's anniversary party
Attached Image (click to enlarge)
Click to Enlarge

Name: eurusd_mn.gif
Size: 20 KB
Follow my trading on Twitter and FB: @pumlitch
 
 
  • Post #13,558
  • Quote
  • Edited 2:33pm Jul 18, 2010 2:14pm | Edited 2:33pm
  •  KumoDragon
  • | Joined Sep 2009 | Status: Member | 1,048 Posts
Quoting fxbr56
Disliked
Attachment 509845Hello SonicR's. I feel I know you, as I've been reading your many posts for the past 2 weeks. This is my first post and contribution. Hopefully I'll be able to contribute to your efforts and you to mine.

I'm a part-time trader and am trading with the SonicR system exclusively. I've tried trading before with a variety of different methods and techniques, but haven't had the consistent success I've seen with using the SonicR system.

Thanks for all your posts and instructions. I've written a little Excel spreadsheet (for...
Ignored
Nicely done. What calculation do I change for the first lot size calculator box to spit out mini lots? For instance 1.0 lot on my mini account = $1.00. And if that was the lots size I wanted I'd enter 1.0 size into the trade volume selection.

Nevermind, figured it out myself. You just take the (/100) out of the end of the equation and it spits out the correct mini lot.

Very handy, now instead of doing it all myself on a calculator, I can just plug in the pips risked and get my lot size.
 
 
  • Post #13,559
  • Quote
  • Jul 18, 2010 5:07pm Jul 18, 2010 5:07pm
  •  lawgirl21
  • Joined Dec 2009 | Status: Member | 6,603 Posts
Quoting traderathome
Disliked
A Word About Technicals:

Except for one, every technical there ever was, is, or will be is based on price......They are all derived from some mathematical screwing around with the price itself. They just "convert" the picture of the waves created by the price, into some other picture with the intent of making something more recognizable. And then users of these technicals make the "leap of faith" and start using them as "predictors"!

No one knows where the price will be a day hence, or an hour hence, or even a few minutes hence.....except...
Ignored
You were so right about the gap down!
 
 
  • Post #13,560
  • Quote
  • Edited 5:26pm Jul 18, 2010 5:07pm | Edited 5:26pm
  •  wh1zz0
  • Joined Aug 2008 | Status: *Sic Parvis Magna* | 838 Posts
Hi guys,

Does anybody know how I can adjust the Market Panel Display Controller to make my price line show as the default MT4 price line color? After installing the indicator, my price line changed color from default gray to medium blue which is quite distracting.

Any help would be appreciated.. Thanks in advance


.....EDIT::

Okay guys, don't bother, I found the solution, just changed the grid color in properties back to LightSlateGray.

Only problem I have now is the High & Low Range.. It's plotting differently, it's at an area where price never got to on Friday.
 
 
  • Commercial Content
  • /
  • Sonic R. System
  • Reply to Thread
    • 1 676677Page 678679680 4160
    • 1 Page 678 4160
2 traders viewing now, 1 is a member:
Riechie.W
  • More
Top of Page
  • Facebook
  • Twitter
About FF
  • Mission
  • Products
  • User Guide
  • Media Kit
  • Blog
  • Contact
FF Products
  • Forums
  • Trades
  • Calendar
  • News
  • Market
  • Brokers
  • Trade Explorer
FF Website
  • Homepage
  • Search
  • Members
  • Report a Bug
Follow FF
  • Facebook
  • Twitter

FF Sister Sites:

  • Metals Mine
  • Energy EXCH
  • Crypto Craft

Forex Factory® is a brand of Fair Economy, Inc.

Terms of Service / ©2023