|
Joined Dec 2007
|
Status: Cash Rules Everything Around Me
|749 Posts
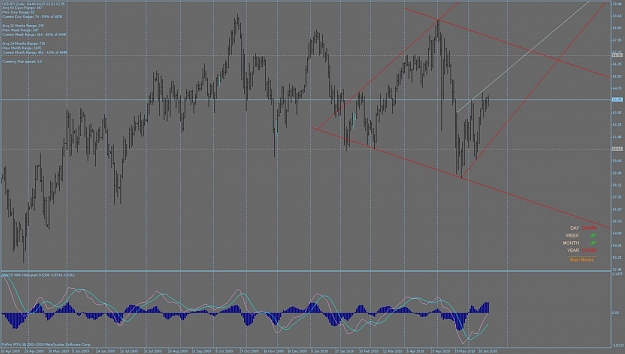
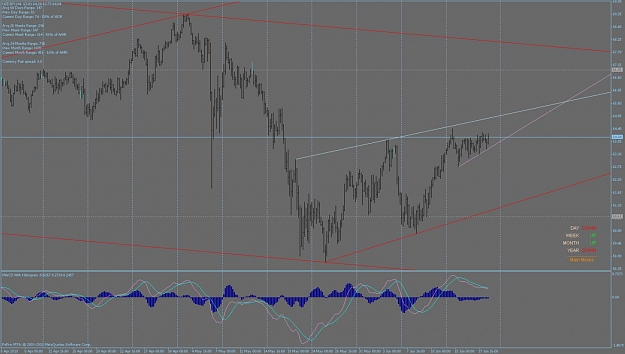
On NZD/JPY I see what potentially may be a diamond (too early to make any conclusions), but not really a big fan of the placement so I'm thinking it could be something else. I also see what appears to be a wedge in there.
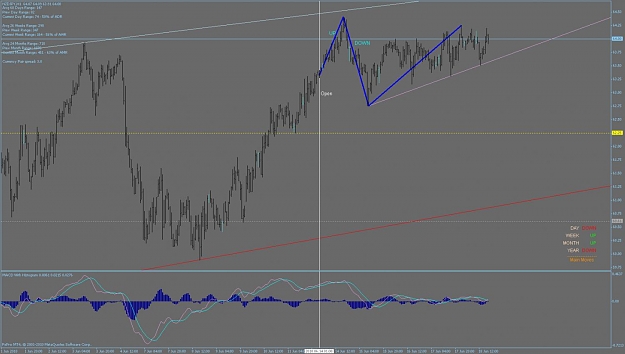
EDIT: On the 4 hr close up of the wedge I notice a 3 touch TL and thinking a 20.6 could be played.
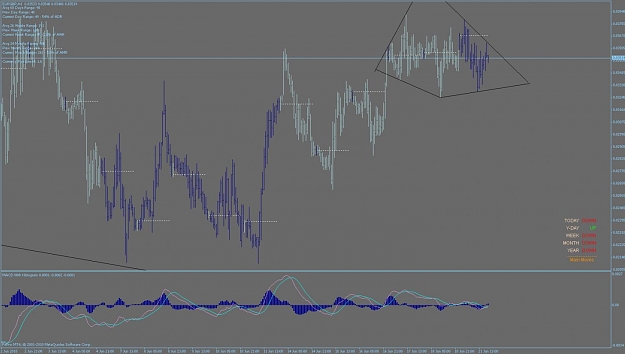
EDIT2: Apologies if this should be posted in the indicator thread. It shows MMOW as up, but as far as I can tell, the MMOW is down until 64.41 (my feed) is taken out. Correct?
Hi there I need to ask that how do you know if a currency is strongest or weakest ? Is there a website or something that can tell you ? Thanks in advance
The finest tool in the world still needs a MAN who KNOWS how to use it.
Hi there I need to ask that how do you know if a currency is strongest or weakest ? Is there a website or something that can tell you ? Thanks in advance
Ignored
Also what you guys think about this ( i am trying to learn igrok method )
Attached Image (click to enlarge)
The finest tool in the world still needs a MAN who KNOWS how to use it.
On NZD/JPY I see what potentially may be a diamond (too early to make any conclusions), but not really a big fan of the placement so I'm thinking it could be something else. I also see what appears to be a wedge in there.
Ignored
Hi there FXChi,
The sequence being played out is valid for a diamond, ie, it appears to be a broadening triangle, and the price is moving inside in a down, up, down, up sequence. But on the other hand I don't like the way the first main diagonal moves almost parallel with the upper TL. It just doesn't look like a typical diamond formation compared to others I have seen. But hey, it could well play out like one. Do any experienced dudes here have an opinion on this?
Quote
Disliked
EDIT: On the 4 hr close up of the wedge I notice a 3 touch TL and thinking a 20.6 could be played.
20.6 would make sense, price is inside a larger channel and if you believe price moving down would be the next logical move, but then this would invalidate your even bigger diamond. The next sequence in your diamond should be up. So now you need to decide whether the diamond is real or not
Quote
Disliked
EDIT2: Apologies if this should be posted in the indicator thread. It shows MMOW as up, but as far as I can tell, the MMOW is down until 64.41 (my feed) is taken out. Correct?
I believe the main move indicates the latest trend, so from what I can see it is right, with the last main move showing as an uptrend. I don't believe it measures the distance in moves, which is maybe why you believe it should be down, as the previous down move covered more distance than the latest upmove?
Can anyone clarify this for all our peace of mind?
|
Joined Dec 2007
|
Status: Cash Rules Everything Around Me
|749 Posts
Thanks Niteshift.
Quote
Disliked
20.6 would make sense, price is inside a larger channel and if you believe price moving down would be the next logical move, but then this would invalidate your even bigger diamond. The next sequence in your diamond should be up. So now you need to decide whether the diamond is real or not
I was looking at the trade again over the weekend and I sort of like the 20.6 set-up. I can make a case for that template keeping the optimistic target of the opposite side of the wedge and preliminarily targeting div target 62.25, and if I SR I can be even more optimistic playing the larger diamond with ultimate 69.95 target although I'd most likely take some off at ADR target.
I wouldn't take a short position at the top of the wedge because of the consolidation we've seen over the past 4 days between 64.26-63.16 so I'm thinking the ascending resistance will fail plus Igrok says it's dangerous to short at ascending resistance.
Agreed that if 20.6 plays out the diamond will be invalid. I'm rather impartial to the diamond simply because of all the PA to the left.
Quote
Disliked
I believe the main move indicates the latest trend, so from what I can see it is right, with the last main move showing as an uptrend. I don't believe it measures the distance in moves, which is maybe why you believe it should be down, as the previous down move covered more distance than the latest upmove?
Hmmm....not sure I follow that. If bottom was formed first, and then top, the direction is up. If top was formed first and then bottom direction is down.
When I look at the NZD/JPY chart from opening of last week I see bottom formed first, and then top = MM Up. Then the low is taken out which means sequence is now top formed then bottom = MM Down. I think MMOM is Up though.
My understanding is MM is dependent on the opening of whatever time scale I choose, the sequence of moves after that opening, and the extremes holding - in the case of MM Up, the low cannot be taken out and in the case of MM Down, the high cannot be taken out.
Of course more seasoned traders on this please clarify.
Hi there I need to ask that how do you know if a currency is strongest or weakest ? Is there a website or something that can tell you ? Thanks in advance
Ignored
Supremechaos is right, you can look at all the crosses and see which is strongest and weakest.
This is a very cool website for strongest and weakest too:
http://finviz.com/forex.ashx
|
Joined May 2010
|
Status: Looking for the KO trade
|471 Posts
Quote
Disliked
Hmmm....not sure I follow that. If bottom was formed first, and then top, the direction is up. If top was formed first and then bottom direction is down.
When I look at the NZD/JPY chart from opening of last week I see bottom formed first, and then top = MM Up. Then the low is taken out which means sequence is now top formed then bottom = MM Down. I think MMOM is Up though.
My understanding is MM is dependent on the opening of whatever time scale I choose, the sequence of moves after that opening, and the extremes holding - in the case of MM...
Hi FXChi,
Yes, I see what your saying, although I still think it just tells us what the last main move was, and on your chart it shows an upmove. I don't think it cares about previous extreme lows or highs, just the move in relation to the open price possibly.
Anyway, forgive me if I'm wrong, I do feel like the blind leading the blind somewhat, and I've tried to find more info on this part of the indicator, but have failed. I hope someone who knows exactly how this indicator works can give us a proper explanation. Belekas, Mr.C, anyone?
Ignored
Good morning niteshift02 and FXChi. Which pair MM got you confused?
Good morning niteshift02 and FXChi. Which pair MM got you confused?
Ignored
Good morning Belekas,
This was to do with FXChi's query regarding the Weekly MM for NZDJPY
Quote
Disliked
Apologies if this should be posted in the indicator thread. It shows MMOW as up, but as far as I can tell, the MMOW is down until 64.41 (my feed) is taken out. Correct?
Here is the chart:
Attached Image (click to enlarge)
We both have differing opinions on how the MM indicator should work. Are you able to explain exactly how it defines what the main move is. Thanks very much for your time Belekas, you are a legend mate
We both have differing opinions on how the MM indicator should work. Are you able to explain exactly how it defines what the main move is. Thanks very much for your time Belekas, you are a legend mate
Ignored
Previous weeks MM was DOWN. Your interpretation is correct. Sometimes the indi might spit a bug out so I would recommend following pure PA until you are confident with the concept. I'll ask my programmer to see whats up. Appreciate the support.
Previous weeks MM was DOWN. Your interpretation is correct. Sometimes the indi might spit a bug out so I would recommend following pure PA until you are confident with the concept. I'll ask my programmer to see whats up. Appreciate the support.
Ignored
Thanks Belekas,
So just to clarify, the main move on the indicator should be the latest move, and is that in relation to the open price? For example if price moves up above the weekly open, it is considered UP for the week?
So just to clarify, the main move on the indicator should be the latest move, and is that in relation to the open price? For example if price moves up above the weekly open, it is considered UP for the week?
|
Joined Dec 2007
|
Status: Cash Rules Everything Around Me
|749 Posts
Thanks Bel and Niteshift. I thought I understood MM pretty well, but didn't realize the indie sometimes had a bug. I notice a couple charts has MMOY and the version I have doesn't, so perhaps there's a later version. I'll check it later.
Niteshift - shoot me a pm if you don't understand MM.