• Home
  • Forums
  • Trades
  • News
  • Calendar
  • Market
  • Brokers
  • Login
  • Join
  • User/Email: Password:
  • 5:34am
Menu
  • Forums
  • Trades
  • News
  • Calendar
  • Market
  • Brokers
  • Login
  • Join
  • 5:34am
Sister Sites
  • Metals Mine
  • Energy EXCH
  • Crypto Craft

Options

Bookmark Thread

First Page First Unread Last Page Last Post

Print Thread

Similar Threads

Daily Highs and Lows to Previous Daily Highs and Lows 1 reply

trading higher highs and lower lows on a 15m chart 15 replies

MT indicator for higher lows / lower highs? 3 replies

Higher Highs/ Lows and Lower Highs/ Lows 14 replies

Lower highs and Higher Lows 3 replies

  • Platform Tech
  • /
  • Reply to Thread
  • Subscribe
  • 19
Attachments: Programming higher lows and lower highs
Exit Attachments
Tags: Programming higher lows and lower highs
Cancel

Programming higher lows and lower highs

  • Last Post
  •  
  • Page 1 2
  • Page 1 2
  •  
  • Post #1
  • Quote
  • First Post: Apr 29, 2010 5:08am Apr 29, 2010 5:08am
  •  Vantage
  • Joined Mar 2007 | Status: Member | 7,195 Posts
I have been trading higher lows and lower highs for some time based on this thread http://www.forexfactory.com/showthread.php?t=108544

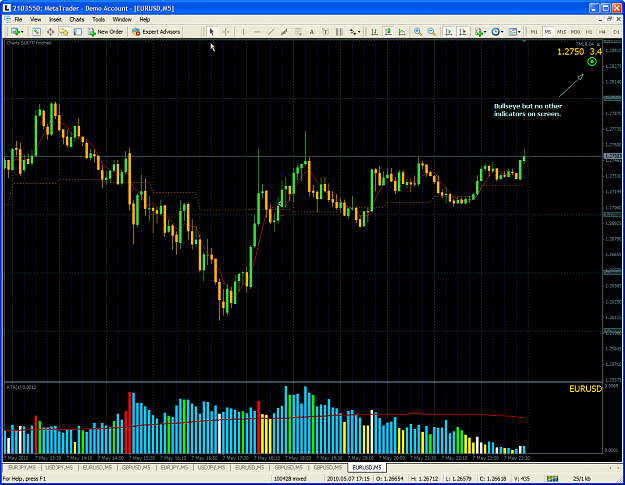
A classic trade is todays, the 1 hr chart has a positive close. So we are looking to trade higher lows on 5 min following subsequent positive closes on 15 min. Including the 15 min is a filter as it is possible to have a 5 min higher low where the last 15 min candle is a negative close. These are the 3 time frames I use.

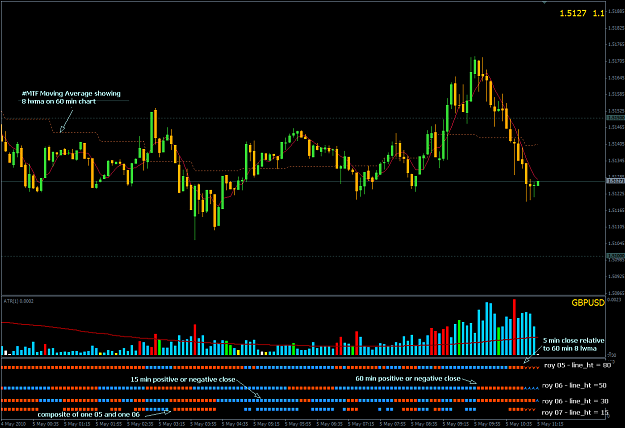
The 15 min and 5 min chart shows red lines where the 1hr closes. There will be trades where the close of a 1hr candle will be a trade as the 15 min and 5 min will have the same positive closes.

There will also be trades like today where there is an immediate pullback after the 1hr closes.

Charts shown - 1hr with 8 lwma (gold) on close. The 15 min has 32 lwma and 5 min a 96 lwma for the hourly equivalents. I typically use a cross of 5 min 8 lwma (blue) as a nice visual confirmation of a higher low or lower high.


Basics required:

  1. Using the standard mt4 times a dashboard showing positive and negative closes for each time frame. Options to switch off specific times as some may wish to scalp more than others. A positive close being a close in upper half of candle and a lower close in the bottom half.
  2. Filter, option to buy above 1hr 8 lwma (set on close) and sell below the 1hr 8 lwma (set on close).
  3. Filter, option that 5 min chart must cross from below and close above an 8 lwma for buys. For sells 5 min must cross from above and close below 8 lwma.
  4. Once set up I do manual entries where price moves 1 pip above/below the extreme of 5 min set up candle. If this is to be used an option to take trade on this basis on lowest time frame enabled for those wishing to use different time frames.
  5. I use a 20 pip max deviation for manual entries on fxpro a 5 digit broker eg 1.52500.
  6. Stops I use +- 15 pips
  7. Take profits. If code writers have good options for this fine. Would suggest perhaps a move to break even at +20 (have this as variable option). After that perhaps we could discuss.
  8. Option to confirm manually ie to use as a signal only.
  9. Option to have alerts, charts, audible and perhaps email?

I get decent trades like this virtually on a daily basis mainly from London morning session. Worth developing further.

Attached Image(s) (click to enlarge)
Click to Enlarge

Name: 1.gif
Size: 27 KB
Click to Enlarge

Name: 2.gif
Size: 23 KB
Click to Enlarge

Name: 3.gif
Size: 23 KB
  • Post #2
  • Quote
  • Edited May 6, 2010 2:10am May 5, 2010 4:30am | Edited May 6, 2010 2:10am
  •  Royston
  • | Joined Nov 2008 | Status: Member | 280 Posts
.... and there was me, all the time thinking a positive close candle was one in which the Close was higher than the Open, ie a green one. Now that I see you have a different meaning for the term, I have put together 2 rough indicators to check out the beginning part of the logic. The indicators show little arrows at the hard right edge, to show the higher time frame candle has not completed, and then the arrows change to squares to let us see the result earlier in the day.

Vantage positive closes roy 05 - gives a blue square if the price closes above the 8 lwma on the 60 min time frame, and a red if it closes under.

Vantage positive closes roy 06 - gives a blue square if the Close is in the upper half of the candle designated by the TImeFrame parameter, and a red if the close is in the lower half of the candle

Vanatge positive closes 07 combines 05 and one time frame of 06 into the same indicator

Drag the indicators into the SAME subwindow. Altering the line_ht parameter between 0 and 100 for each indicator drag, will place the lines of blue squares at differing heights. This is just a way of getting more information into one window, rather than spreading it over more windows.

I realise this is not a dashboard, but it is a way of looking at effectiveness of the underlying components of each piece of the logic, with a view to adjusting their effectiveness. It doesn't look at the hard right edge, which is the goal, but it does look at where the hard right edge has been.

I have also attached 2 indicators which let you see a higher time frame condition on the 5 min chart. Which are
#MTF Moving Average - which, (when set to TimeFrame 60, MAPeriod 8, ma_shift 0, ma_method 3, applied_price 0 )shows the position of the 8 lwma on the 60 min time frame,

and

CustomCandle6, which when set to 15 shows the 15 min candle on a 5 min time frame.
Attached Image (click to enlarge)
Click to Enlarge

Name: 100504 0922 Vantage positive closes chart.png
Size: 28 KB
Attached File(s)
File Type: ex4 Vantage positive closes roy 05.ex4   4 KB | 284 downloads
File Type: mq4 #MTF_MovingAverage.mq4   4 KB | 323 downloads
File Type: mq4 CustomCandle6.mq4   9 KB | 286 downloads
 
 
  • Post #3
  • Quote
  • May 5, 2010 4:34am May 5, 2010 4:34am
  •  Vantage
  • Joined Mar 2007 | Status: Member | 7,195 Posts
Quoting Royston
Disliked
.... and there was me, all the time thinking a positive close candle was one in which the Close was higher than the Open, ie a green one. Now that I see you have a different meaning for the term, I have put together 2 rough indicators to check out the beginning part of the logic. The indicators show little arrows at the hard right edge, to show the higher time frame candle has not completed, and then the arrows change to squares to let us see the result earlier in the day.

Vantage positive closes roy 05 - gives a blue square if the price closes...
Ignored
Thanks Royston
I'm off to bed again will check out real soon. Thanks.
 
 
  • Post #4
  • Quote
  • May 5, 2010 9:22am May 5, 2010 9:22am
  •  Vantage
  • Joined Mar 2007 | Status: Member | 7,195 Posts
Hi Roy
Thanks so much.
The 06 indi for some reason with a time setting of 15 is only showing 4 bars. Wierd. Any ideas?
Attached Image (click to enlarge)
Click to Enlarge

Name: 1.gif
Size: 23 KB
 
 
  • Post #5
  • Quote
  • May 5, 2010 9:43am May 5, 2010 9:43am
  •  Royston
  • | Joined Nov 2008 | Status: Member | 280 Posts
The 06 on my attachment image is showing positive and negative closes on the 15 min. Try changing timeframes to 30 mins and then back to 5 mins again to flush the buffers
 
 
  • Post #6
  • Quote
  • May 5, 2010 9:51am May 5, 2010 9:51am
  •  Vantage
  • Joined Mar 2007 | Status: Member | 7,195 Posts
Quoting Royston
Disliked
The 06 on my attachment image is showing positive and negative closes on the 15 min. Try changing timeframes to 30 mins and then back to 5 mins again to flush the buffers
Ignored
Hi Royston
I've flushed my buffers (surprisingly feel none the worse having done that!!) and gu shows last 4 blocks. EJ and eu are fine!!!!!!!
 
 
  • Post #7
  • Quote
  • May 5, 2010 10:14am May 5, 2010 10:14am
  •  Vantage
  • Joined Mar 2007 | Status: Member | 7,195 Posts
Quoting Vantage
Disliked
Hi Royston
I've flushed my buffers (surprisingly feel none the worse having done that!!) and gu shows last 4 blocks. EJ and eu are fine!!!!!!!
Ignored
Even wierder if I have another time frame open add the template it loads fine, as soon as I change the time frame on gu to 5 min it takes the blocs down to 4.
 
 
  • Post #8
  • Quote
  • May 5, 2010 11:42am May 5, 2010 11:42am
  •  Royston
  • | Joined Nov 2008 | Status: Member | 280 Posts
Try this.

For some reason, Metatrader does not like the divide operation,

ie it hates [(Hi-Close)/(Hi - Lo)]> 0.5 but it really likes (hi-Close)> [(Hi-lo)*0.5] ....

I know these indis are a bit klutzy, but they are more in the way of diagnostic tools to let you look at how effective the logic is. You need to beware of the fact that on the 5 min chart it looks obvious that a 15 min bar has a negative close, but that is often not confirmed until the bar has closed which can be 15 mins into the future. It can be very deceptive.

PS throw roy 07 away, because it contains the divide operation
Attached File(s)
File Type: ex4 Vantage positive closes roy 06.ex4   4 KB | 260 downloads
 
 
  • Post #9
  • Quote
  • May 6, 2010 2:02am May 6, 2010 2:02am
  •  Vantage
  • Joined Mar 2007 | Status: Member | 7,195 Posts
Quoting Royston
Disliked
Try this.

For some reason, Metatrader does not like the divide operation,

ie it hates [(Hi-Close)/(Hi - Lo)]> 0.5 but it really likes (hi-Close)> [(Hi-lo)*0.5] ....

I know these indis are a bit klutzy, but they are more in the way of diagnostic tools to let you look at how effective the logic is. You need to beware of the fact that on the 5 min chart it looks obvious that a 15 min bar has a negative close, but that is often not confirmed until the bar has closed which can be 15 mins into the future. It can be very deceptive.

PS throw roy...
Ignored
Cheers Royston
About the closing in upper half or lower, thats just a general rule, you still need to be aware of wicks etc and dojis prob the biggest risk, ie buying after a doji at end of run up.
Thanks.
I'll make a summary of these on hl lh thread.
Cheers.
 
 
  • Post #10
  • Quote
  • Edited May 7, 2010 3:46am May 6, 2010 12:17pm | Edited May 7, 2010 3:46am
  •  Royston
  • | Joined Nov 2008 | Status: Member | 280 Posts
Quoting Vantage
Disliked
Cheers Royston
About the closing in upper half or lower, thats just a general rule, you still need to be aware of wicks etc and dojis prob the biggest risk, ie buying after a doji at end of run up.
Ignored
New improved version. Washes whiter than white and has a new doji identifier, sort of. If the Open and Close are both within a 65% and 35% band, (adjustable) colour changes to yellow.
Attached File(s)
File Type: ex4 Vantage positive closes roy 06 with doji.ex4   5 KB | 289 downloads
 
 
  • Post #11
  • Quote
  • May 7, 2010 5:04am May 7, 2010 5:04am
  •  Royston
  • | Joined Nov 2008 | Status: Member | 280 Posts
Attached is a indicator which will place a red or green bullseye on the chart when all 3 lines show the same colour. It is a first pass and very rough and ready. It reads the 2 indicators Vantage positive closes 05 & 06 remotely, so both of those need to be in the Custom Indicator folders. It reads them with the value of 8 lwma on the 60 on the close, and then 15 and 60 min positive or negative close candles. It should work on any pair on any time frame (meaning if placed on the 60 min chart, it will still indicate the same results as if placed on the 15 min or 5 min). I think...
Attached File(s)
File Type: ex4 V System chart indicator roy 02.ex4   4 KB | 307 downloads
 
 
  • Post #12
  • Quote
  • May 8, 2010 12:35pm May 8, 2010 12:35pm
  •  Vantage
  • Joined Mar 2007 | Status: Member | 7,195 Posts
Quoting Royston
Disliked
Attached is a indicator which will place a red or green bullseye on the chart when all 3 lines show the same colour. It is a first pass and very rough and ready. It reads the 2 indicators Vantage positive closes 05 & 06 remotely, so both of those need to be in the Custom Indicator folders. It reads them with the value of 8 lwma on the 60 on the close, and then 15 and 60 min positive or negative close candles. It should work on any pair on any time frame (meaning if placed on the 60 min chart, it will still indicate the same results as if placed...
Ignored

Hi Royston
I have the x and y as 5 and 10 respectively. Can you pls confirm that this will give a doji if within 45-55%, ie what I would regard as a true doji, cheers.
 
 
  • Post #13
  • Quote
  • Edited 5:59pm May 8, 2010 4:16pm | Edited 5:59pm
  •  Royston
  • | Joined Nov 2008 | Status: Member | 280 Posts
Quoting Vantage
Disliked
Hi Royston
I have the x and y as 5 and 10 respectively. Can you pls confirm that this will give a doji if within 45-55%, ie what I would regard as a true doji, cheers.
Ignored
Hi V,

I put together a summary for anyone else reading this, which hopefully also answers your question.

"05" - is an indicator that, when dropped on the chart, shows up in a sub-window. It shows whether the close is above or below the 8 lwma on the 60 chart. These parameters are user adjustable, so could show the close relative to a 55 ema on the 15 for example, but default is 8 lwma on 60 min chart.

"06" is an indicator that, when dropped on the chart, shows up in a sub-window. It shows if the chosen timeframe candle closes above the midway part of the range, or below the midway part of the range, denoted by red for below and green for above the 50% midway point. This is what you refer to as a positive or negative close. Timeframe is user adjustable in this indicator.

"06 with doji" has a few extra lines of code that allow a third colour, yellow, to indicate whether the open and close are both within the user adjustable limits set as default to 65% and 35%. So, using the default

  1. a close between 100% (the high) and 65% will show as green irrespective of where the open was,
  2. between 65% and 35% shows as yellow, if the open was also between 65 and 35,
  3. and a close of 35% down to 0% (the low) shows as red irrespective of where the open was.

The 65% and 35% levels are user adjustable and you can change them to other values. I set them to 65 and 35 because a narrower band did not pick up candles that visually I would have called a doji. Personally, I do not use "06 with doji", because I have taken to watching the 15 min chart with the bullseye as much as the 5 min chart, and see the dojis direct.

Line_ht refers the vertical position of the line of blocks in the sub-window for all three indicators.


"V System chart indicator roy 02" ( or the "bullseye") is the Hard Right Edge indicator, and draws its data from using the "05" and "06" indicators which need to be present in the Custom indicator folder. They do not need to be on screen at all for that pair, but they do need to be in the Custom Indicator folder. It does not draw data from "06 with doji" (which was a small tweak to the original to give a visual warning of a doji).
Internally, the bullseye is set to respond to

  1. the close being above or below 8 lwma on the 60 min chart for the 05 reference,
  2. and positive or negative closes for 15 min candle relative to a 50% midway point for the 06 reference.
  3. and positive or negative closes for 60 min candle relative to a 50% midway point for the next 06 reference.

These values are not user adjustable, but could be made so if desired.
When all 3 criteria are green, a green bullseye appears.
When all 3 criteria are red, a red bullseye appears.
The x distance and y distance alter the position of the bullseye relative to the top corner of your screen. I use my Magnified Price indicator in the top right corner to give me 4 digits and the spread, so the default for the bullseye is set to below these price figures for me.

Attached Image(s) (click to enlarge)
Click to Enlarge

Name: 100508 2036 EURUSD for V.png
Size: 67 KB
Click to Enlarge

Name: 100508 2048 EURUSD for V.png
Size: 71 KB
 
 
  • Post #14
  • Quote
  • Edited 3:57pm May 11, 2010 3:17pm | Edited 3:57pm
  •  gilos
  • | Joined Sep 2008 | Status: Member | 62 Posts
thanx vantage and royston for this indicator...i found it very useful...just two quick q though:

1. do we need to flush buffer always to make sure the color is correct?

2. e.g. 06 indicator set to 60 on tf5...is the 50% relative to current candle on h1 or 1 candle before? if current candle, can we have a 1 candle before indi? I couldn't do this on my own as the file is ex4, and it would be rude if I decompile it...(not that if I could if it was in mq4 )

3. can royston make an alarm for this? for instance when 06 setting 5,15,30 all same color?

anyway, thanx a lot guys...
 
 
  • Post #15
  • Quote
  • Edited 11:23pm May 12, 2010 2:08pm | Edited 11:23pm
  •  gilos
  • | Joined Sep 2008 | Status: Member | 62 Posts
after testing the indi, I can see that it is repainting the past...

As I suspected, the indi (06) shows the current condition of the time frame that we set right?

for instance if I set it to show m30 on m5, if it shows red, it means that the current m5 candle closes below 50% of current m30 candle rite?

This for me can be a bit deceiving coz, when the m30 candle starts anew, if the price goes below open, the indi bar on m5 chart will be red coz the range is not that big yet...

This indi is meant to be used for HL LH system rite? so, IMHO, we should use the candle before the current candle as reference...

for instance, the setting still the same as before, m30 on m5 chart... if the m5 cs closes above 50% of one candle before on m30, it colors green...
_______________________________________________________________

If we can add to this, an indi like 06 doji, except this time, if m5 cs closes above the open of current m30 candle, it colors green as well...

so now, we know that the current price is above 50% of last m30 cs, and above current m30 open, thus bullish...vise versa for bearish...

and the color bar, IMHO should show the bar in the active tf...
for instance, m30 on m5 tf...in 30 minutes we have 12 m5 cs...let say 6 cs before, the bar color is green, but then on the 7th cs, the price close below 50%...now all 7 bar color will be red...

IMHO it should be red only for the 7th bar...not all...

hope my suggestion can be materialized...thanx for this indi anyway...
 
 
  • Post #16
  • Quote
  • May 13, 2010 2:13am May 13, 2010 2:13am
  •  Vantage
  • Joined Mar 2007 | Status: Member | 7,195 Posts
Quoting gilos
Disliked
after testing the indi, I can see that it is repainting the past...

As I suspected, the indi (06) shows the current condition of the time frame that we set right?

for instance if I set it to show m30 on m5, if it shows red, it means that the current m5 candle closes below 50% of current m30 candle rite?

This for me can be a bit deceiving coz, when the m30 candle starts anew, if the price goes below open, the indi bar on m5 chart will be red coz the range is not that big yet...

This indi is meant to be used for HL LH system rite? so,...
Ignored
Repainting the past?

When a candle is closed you get red or green squares meaning that candle closed in its upper or lower half, ie positive or negative. No re-painting there.

The current open candle is represented by arrows and will move up or down as that candle moves around. Thats not re-painting its just telling whats happening on the open candle.

So in answer to your Q the squares show closed candles and the arrows the current position of an open candle.

Shouldn't be confusing if you have solid green candles at the end of an hour that co-incides with a hl on 5 min buy (check candles don't have upper wicks), if after the candle closes and new candle goes red arrow down, again thats fine as you are now waiting for a small cycle to complete and to then around go green for a hl, which you then buy.

This is as per the higher low lower high thread. There are numerous charts and examples posted there.
 
 
  • Post #17
  • Quote
  • May 13, 2010 2:59am May 13, 2010 2:59am
  •  gilos
  • | Joined Sep 2008 | Status: Member | 62 Posts
Quoting Vantage
Disliked
Repainting the past?
Ignored
I don't mean the bars for the tf that we set and that has completed...

what I mean is, for instance I set m30 on m5 chart...there are 6 cs to complete one m30 cs rite? ok let's say the new m30 cs has opened and the price goes up a bit...on the 1st m5 bar, the color will be green bcoz the range is not that big yet...then that 1st m5 cs complete and bar stays green...but on the 2nd m5 cs, the price goes down, and because range is not that big, the both the 1st and 2nd bar color goes red...my concern is:

1. why can't the 1st bar on m5 stays green?

2. If we can set the cs reference on m30 to be a candle before the current candle, I think it's abit ok, coz we know that if green, the price is above 50% m30 cs before

3. if we can add another indi that shows if the current cs on m5 is above or below m30 open, then it would be better coz price above open= bullish...

with the current indi, if we have an umbrella or a hanging man on m30, the bar would show green, irrespective of 06 or 06 doji...

but that's just my opinion... I hope the modified indi can be materialized...if it is not, I would like the permission from royston to decompile and alter his indi, if it's ok with him...
 
 
  • Post #18
  • Quote
  • Edited 3:53pm May 14, 2010 3:04am | Edited 3:53pm
  •  Royston
  • | Joined Nov 2008 | Status: Member | 280 Posts
hullo gilos,

Hmm, where to start lah .....

As Vantage explained above, the indicator does not repaint the past. It just summarises the present state of the higher time frames.

In post 1, Vantage specified what he uses as the trend criteria. He defined a positive close as meaning the close in the upper half of the candle. Indicator 06 is a rough and ready thrown together indicator, which shows where the close is relative to the 50% line of the current higher time frame candle. I know it makes people uncomfortable that halfway through forming the upper timeframe bar, it changes from a positive close to a negative close, but hey, that's life. It is the uncertain reality of the present versus the much more comfortable feeling you get when you look at the past.

There are many ways of trying to represent trend. Vantage has just chosen this not so common way. Other ways are if the high and low of the current candles are lower than the high and low of the previous candle. Or if the moving averages are sloping down. Or if the Trix is red or green. Or if the close is below the previous bars midpoint. This last one is your suggestion, and is as valid as any of the others. It just happens to be different from what Vantage was looking at

Anyway, to your questions:

Quoting gilos
Disliked

1. why can't the 1st bar on m5 stays green?
Ignored
Attached please find the indicator you asked for. Colour is relative to the midpoint of previous higher time frame bar. Once the 5 min candle has completed, it does not change colour. The current higher time frame candle is still shown by arrows.

Quoting gilos
Disliked

2. If we can set the cs reference on m30 to be a candle before the current candle, I think it's abit ok, coz we know that if green, the price is above 50% m30 cs before
Ignored
Sure. However, as with moving averages etc, you will find that by the time you have waited for this indicator to change colour, Vantage has already entered the trade. Funny old world, but you will find the indicator is most accurate on the 5 min chart, lol...

Quoting gilos
Disliked
3. if we can add another indi that shows if the current cs on m5 is above or below m30 open, then it would be better coz price above open= bullish...
Ignored
Here, why not take a look at a 30 min candle? If it is green, it is bullish, red it is bearish. Simples. Plus you get all that extra information about momentum and positioning for free. You are showing the classic signs of "indicatorisis " if you need an indicator for this

The reason I posted ex4 files is that these indicators are only very roughly built, and to be honest, I am embarrassed by the code. It is like a schoolboy's notepad, full of crossings out, smudged ink, torn up bits of paper, and the cat was sick over it. And it smells. It would be a bit like letting you look at my dirty underwear lol. Not that I have dirty underwear, you understand. Anyway, let's not go there... I recommend you take a look at Vantage's thread. Trading is not about the indicators, and these ones were only a way of looking at which way the tide was flowing on the various time frames. They are "clarifiers" not "predictors". They don't predict anything, they just summarise a little of what Vantage was talking about. The candles are much more important. So, don't take a trade just because the boxes all go green.....that would be a nightmare, and completely miss the point.
 
 
  • Post #19
  • Quote
  • May 14, 2010 3:52pm May 14, 2010 3:52pm
  •  Royston
  • | Joined Nov 2008 | Status: Member | 280 Posts
gilos,
apologies, I uploaded the wrong indicator in the last post.

Yours is attached to this one.
Attached File(s)
File Type: ex4 V Gilos close relative to previous mid roy 01.ex4   4 KB | 303 downloads
 
 
  • Post #20
  • Quote
  • May 15, 2010 6:18am May 15, 2010 6:18am
  •  gilos
  • | Joined Sep 2008 | Status: Member | 62 Posts
Quoting Royston
Disliked
hullo gilos,

Hmm, where to start lah .....
Ignored

wow! you are familiar with malaysian slang ar? have you ever been here before? (sorry for off topic a bit ya TS )


Quoting Royston
Disliked
Attached please find the indicator you asked for.
Ignored
Thank you very much bro...


Quoting Royston
Disliked
Here, why not take a look at a 30 min candle? If it is green, it is bullish, red it is bearish. Simples.
Ignored
I respect your opinion then...

Anyway, thanks for the modified indi again, and thanx also for giving me ideas to do my ea...
 
 
  • Platform Tech
  • /
  • Programming higher lows and lower highs
  • Reply to Thread
    • Page 1 2
    • Page 1 2
0 traders viewing now
  • More
Top of Page
  • Facebook
  • Twitter
About FF
  • Mission
  • Products
  • User Guide
  • Media Kit
  • Blog
  • Contact
FF Products
  • Forums
  • Trades
  • Calendar
  • News
  • Market
  • Brokers
  • Trade Explorer
FF Website
  • Homepage
  • Search
  • Members
  • Report a Bug
Follow FF
  • Facebook
  • Twitter

FF Sister Sites:

  • Metals Mine
  • Energy EXCH
  • Crypto Craft

Forex Factory® is a brand of Fair Economy, Inc.

Terms of Service / ©2023