The original idea behind this thread, a good trader said to me that the first retracement is the best trade. The first higher low/lower high.
Trading is the battle between trend and support and resistance. You can never go wrong with some higher time frame analysis to see SR levels.
The latest HL/LH version is as close to a 5 min standalone method as I'd like to get to (with obvious reference to SR levels).
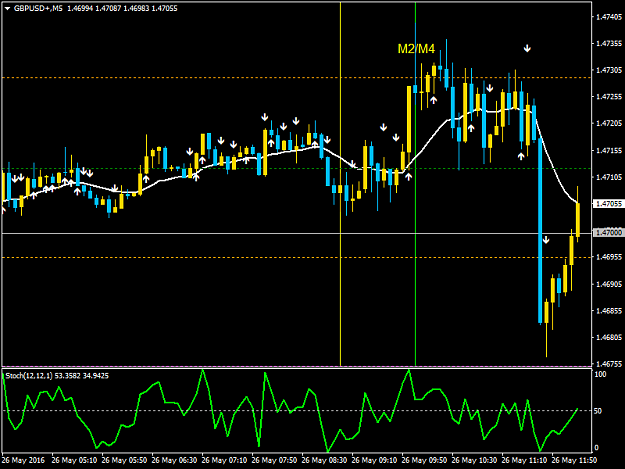
OK so current set up focus on GU and GJ, 5 min 15lwma, 3 bar reversal indi with 9 9 1 stoch filter. GU and GJ to agree (both on same side of their lwma). Same set up with EU and EJ to agree. Of course if the yens are doing their own thing EJ and GJ to agree. Looking to enter the HL/LH's in and around the 15lwma, either a HL/LH that crosses the lwma or after price crossed the first HL/LH that follows.
The 3 bar reversal indicator ( link http://www.forexfactory.com/showthre...22#post8878722) was written to help signal these reversals. It will alert with an arrow down when the signal candle has closed below the previous two candle closes (one of the two prior must be a positive close). It will alert with an arrow up when the signal candle has closed above the previous two candle closes (one of the two prior must be a negative close). The arrow is placed above/below the candle that follows the signal candle. So its purely based on price action and by the above definition catching an initial turn and thereafter resumption of trend move as one of the candles must have closed against the direction of your trade.
Below is the 123 reversal when the price fails to make a lower low or higher high
1. trend line broken (I don't use TL's)
2. lower high in an uptrend, or a higher low in a downtrend.
3. break below the previous low in an uptrend, or above the previous high in a downtrend
At point 3 the reversal is confirmed and everybody’s brother is getting in. A stop run often follows to re-test the penetration at point 3. Quicker traders may get short at the X.
Attached Images
http://cdn.forexfactory.com/attachme...1&d=1278063333
Attached Images
http://cdn.forexfactory.com/attachme...1&d=1278065829
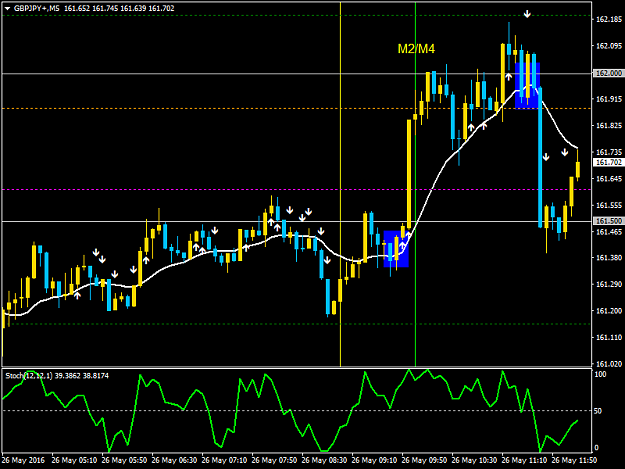
Typically we like candles with little/no wick in the direction of the trade. Stops: Last swing high/low. Exits: Up to you. On GJ if LO has a failed move in one direction then the opposite direction should have a solid move. 50 pips on GJ common to target pivots, SR areas and 50/100 levels.
See the attached GJ chart with the blue rectangles. In and around LO, first trade around the lwma cross, HL, GU agreeing, little/no upper wick buy area 161.50. About 90 minutes after LO, lwma cross, LH, GU agreeing, little/no lower wick, sell area 161.88.
Trading is the battle between trend and support and resistance. You can never go wrong with some higher time frame analysis to see SR levels.
The latest HL/LH version is as close to a 5 min standalone method as I'd like to get to (with obvious reference to SR levels).
OK so current set up focus on GU and GJ, 5 min 15lwma, 3 bar reversal indi with 9 9 1 stoch filter. GU and GJ to agree (both on same side of their lwma). Same set up with EU and EJ to agree. Of course if the yens are doing their own thing EJ and GJ to agree. Looking to enter the HL/LH's in and around the 15lwma, either a HL/LH that crosses the lwma or after price crossed the first HL/LH that follows.
The 3 bar reversal indicator ( link http://www.forexfactory.com/showthre...22#post8878722) was written to help signal these reversals. It will alert with an arrow down when the signal candle has closed below the previous two candle closes (one of the two prior must be a positive close). It will alert with an arrow up when the signal candle has closed above the previous two candle closes (one of the two prior must be a negative close). The arrow is placed above/below the candle that follows the signal candle. So its purely based on price action and by the above definition catching an initial turn and thereafter resumption of trend move as one of the candles must have closed against the direction of your trade.
Below is the 123 reversal when the price fails to make a lower low or higher high
1. trend line broken (I don't use TL's)
2. lower high in an uptrend, or a higher low in a downtrend.
3. break below the previous low in an uptrend, or above the previous high in a downtrend
At point 3 the reversal is confirmed and everybody’s brother is getting in. A stop run often follows to re-test the penetration at point 3. Quicker traders may get short at the X.
Attached Images
http://cdn.forexfactory.com/attachme...1&d=1278063333
Attached Images
http://cdn.forexfactory.com/attachme...1&d=1278065829
Typically we like candles with little/no wick in the direction of the trade. Stops: Last swing high/low. Exits: Up to you. On GJ if LO has a failed move in one direction then the opposite direction should have a solid move. 50 pips on GJ common to target pivots, SR areas and 50/100 levels.
See the attached GJ chart with the blue rectangles. In and around LO, first trade around the lwma cross, HL, GU agreeing, little/no upper wick buy area 161.50. About 90 minutes after LO, lwma cross, LH, GU agreeing, little/no lower wick, sell area 161.88.
Attached Image(s) (click to enlarge)
Attached File(s)