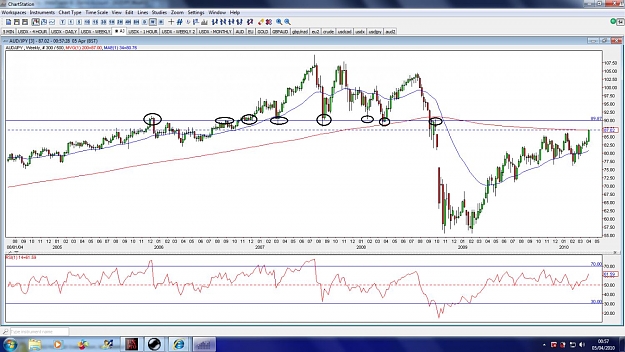
Dislikedthis is how i read my chart on GU
1 > price break below the the red trendline, finding support at 1.48. retrace to test the red trendline and continue it downtrend
2 > price find support at red trendline and possible price stall at 1.53xx and continue it downtrend
3> Price break 1.53xx. i would only consider an uptrend movement if price break above 1.55 and come back to test the blue horizontal trendline
Taking dollar index DXY, USD is having trendline support and i find it following the 10MA S/R quite well on the weekly chart. Personally i...Ignored
a very clean and nice chart, good analysis