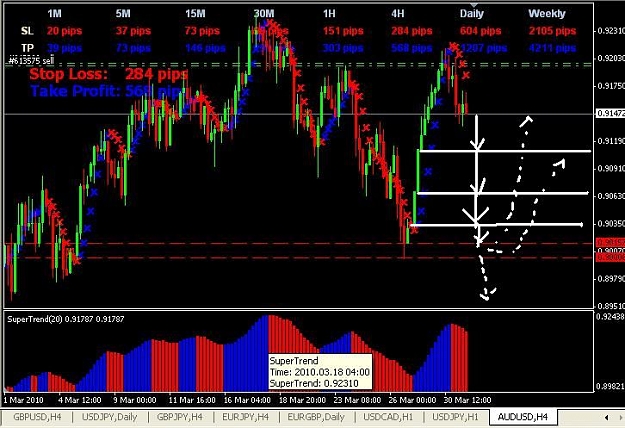
Dislikedhi sky what are those arrows on that chart? the blue and red ones?Ignored
Blue line with Dots are the price action of the Pair in the GannGrid
Whenever RED line cross over in up move it's signaling BUY, or
Green line crossover generates SELL signal.. In other words RED line is
a downtrend and Green line Uptrend.. Check this out for the Reference
You can get Indies and explanations there, thanks to SwingMan
http://www.forexfactory.com/showthread.php?t=217118
Viewer Discretion Advised: Shall we shag now or should we shag later? :-)