DislikedYou are making an error by drawing lower trend line to suit your bias, if you run it properly along the actual lows you will find that it rests below current lows of 1.34 zone and with weekly chart not finishing its bearish phase one can expect new lows sooner than later.Ignored
really ??? isn't a trend defined as higher lows and higher high ? and so far on the MAJOR weekly pivots we have that don't we ?
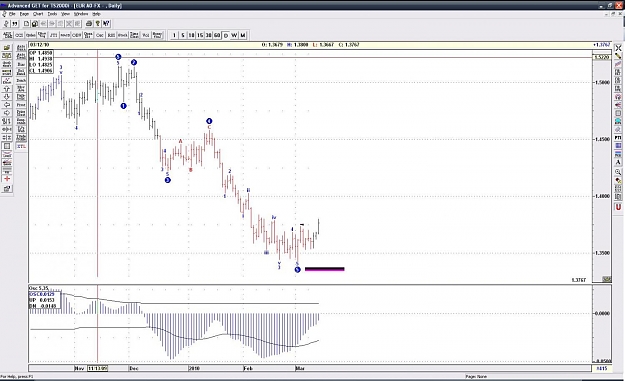
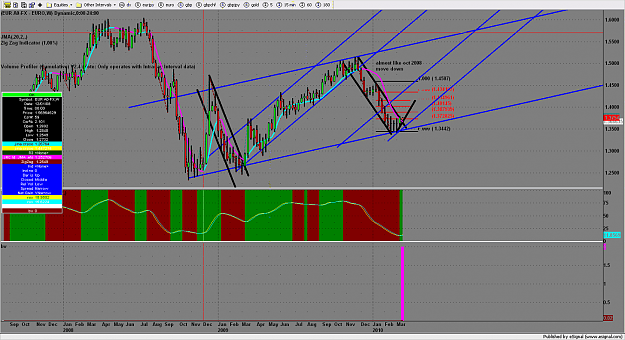
There is a very strong chance with
1) exact 61.8% retracement of 2008 lows to 1.5100
2) 5 doji in a row on weekly
3) rsi more oversold than it has been since 1996
4) Hit the lower trendline ( in fact stopped shy)
5) rounded top on weekly dx
6) massive volume on weekly doji on weekly DX 3 weeks back , last week also very high and this week closed lower than last week.
7) Volume last 4 weeks higher than even 2008 lows
that that lower trend line may hold and if so EU is in fact in an uptrend since lows of 2008 .
Of course within the channel there will be up and down waves and until we break 1.3400 we still have a MAJOR upward trend line.
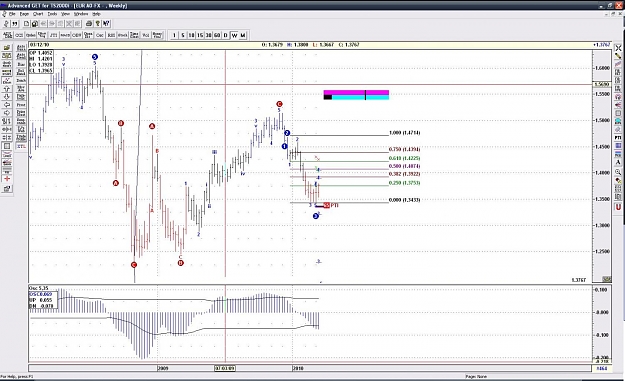
Chart below shows a what if scenario and some interesting possible symmetry scenarios.
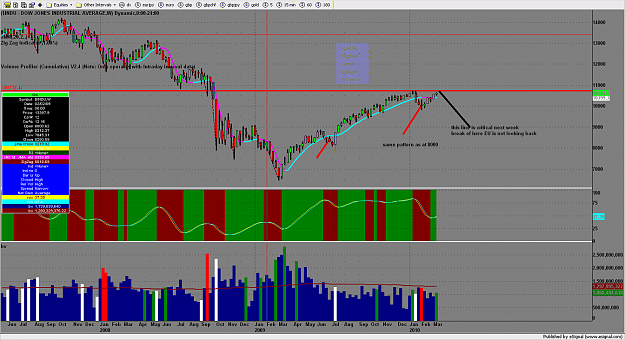
Of course on weekly right now I am only looking for 1.4100 ish and want to see reaction to that. We have not had a true break out of s&p or DJ yet.
If 1,3400 breaks to downside then of course the weekly LTL has been broken and all bets are off on longs.
To be honest I just love debating this stuff as I trade intraday 90% of the time. In this range i have been buying dips of 1.3550 and loving it.
With moves in GU for 70 in London and then another 90 today in US who need to buy and hold anything , unless you do not have time to trade for a few hours a day ( 1hr Frankfurt / London and 3 hours US)
2nd chart is DJ,. That 10750 level is critical, above this DJ rips and usd gets crushed. Rejection off this usd gets stronger EU drops back towards 1.3500.
Attached Image (click to enlarge)
Attached Image (click to enlarge)
Blogging daily now at www.volume.zone