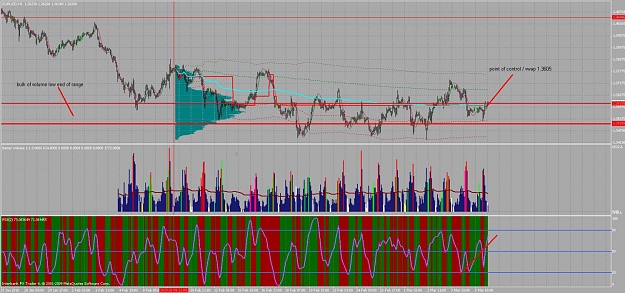
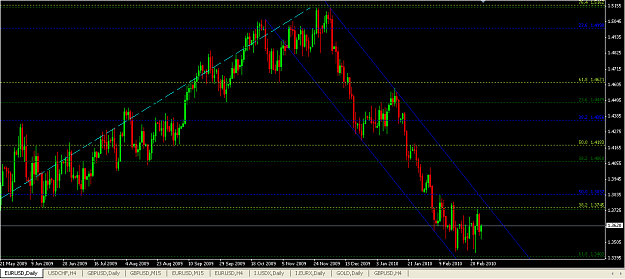
note how the bulk of the volume profiles have been in the 1.3600 to 1.3500 area ? this is due to accumualtion. There really is no selling interest in the high 1.3650 to 1.3800 area .. no buying and no selling .. bulk of volume action is taking place in 1.3500 to 1.3580 zone.
loads of high vol pivots in 1.3550 to 1.3600 area and we just poked above them today
I've decided to study your system, vsa that is. I don't rely on volume to trade and my own system works I just want to try it / learn the concepts. The most confusing thing at this point is that indicator that has I guess a volume indicator on-chart?
Before Forex I was tall, and clean shaven. Now I am an Ewok.
Joined Apr 2007
|
Status: HARD SHYT SCUBA TRADER
|20,886 Posts
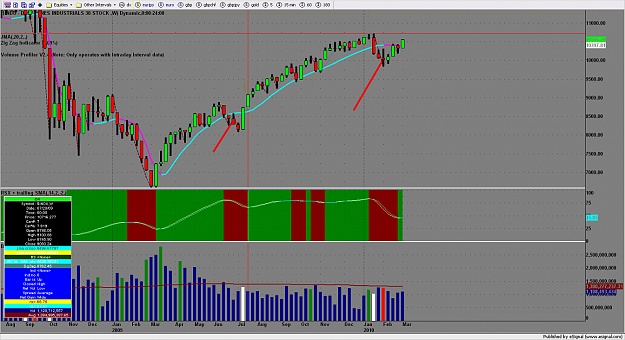
I did say one last chart on last post but then I spotted this
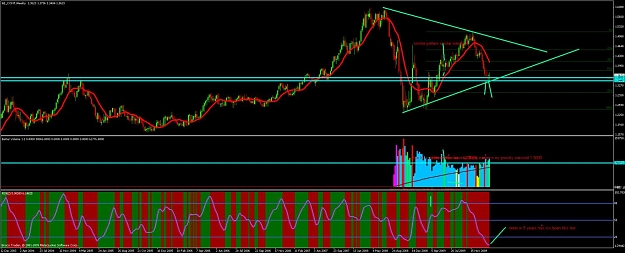
1) drop stopped dead on 61.8% of up move
2) wedge in uptrend ....now all i am figuring is does this mean dj moves back to 14400 ? that would be nuts ... but what else would cause the usd to tank ?
wedge in up trends are bullish 90% of the time and continuation patterns
based on 4 doji on weekly , possible wave 4 reatrcement on weekly .... to 1.3500 rsx being them most oversold it has been since 1997 ( this did move up 500 pip then form 4 dojid at top of range beflroe large drop) and test of 2008 break out levels this could break into 1.5000 long term ...
really bizzare , alot of bullish indicator lining up and with ES already moving into 2009 highs we are not seeing break out of this consolidation range yet ..really odd
I did say one last chart on last post but then I spotted this
1) drop stopped dead on 61.8% of up move
2) wedge in uptrend ....now all i am figuring is does this mean dj moves back to 14400 ? that would be nuts ... but what else would cause the usd to tank ?
wedge in up trends are bullish 90% of the time and continuation patterns
based on 4 doji on weekly , possible wave 4 reatrcement on weekly .... to 1.3500 rsx being them most oversold it has been since 1997 ( this did move up 500 pip then form 4 dojid at top of range beflroe large drop)...
I did say one last chart on last post but then I spotted this
1) drop stopped dead on 61.8% of up move
2) wedge in uptrend ....now all i am figuring is does this mean dj moves back to 14400 ? that would be nuts ... but what else would cause the usd to tank ?
wedge in up trends are bullish 90% of the time and continuation patterns
based on 4 doji on weekly...
Ignored
Dow has pulled out in open field ie broke though short-term resistance. If keeps building momentum above 10,000 pscolevel could well be on it's way to much higher levels. Could be they are willing to let the dollar go for equities to rise. Looking at hrly resistance there's nothing stopping it if they want to bring it higher but in daily timeframe there is enough resistance to push back into a range. Will have to keep close eye.
Attached Image
Before Forex I was tall, and clean shaven. Now I am an Ewok.
I've decided to study your system, vsa that is. I don't rely on volume to trade and my own system works I just want to try it / learn the concepts. The most confusing thing at this point is that indicator that has I guess a volume indicator on-chart?
Ignored
that is just a volume histogram ..
I use value area trading ... kind of s/r lines shall you say . The value area is the top and bottom of 70 % of the volume.
yesterday low value area eu was 1.3550 , when it broke above after nfp and came bacl retested it was long with 20 pip stop
I will post and esignal charts later showing value area as esignal is on a different system .
using value area of prior day each day is a new day , todays and yesterdays upper value is 1.3612 . Now if Sundays / Monday price moves away from this then it is a bullish up day , breaks below and stays below in a sesison for more than 30 min then 80% chance price moves thru the value area to test 1.3550
I use value area trading ... kind of s/r lines shall you say . The value area is the top and bottom of 70 % of the volume.
yesterday low value area eu was 1.3550 , when it broke above after nfp and came bacl retested it was long with 20 pip stop
I will post and esignal charts later showing value area as esignal is on a different system .
using value area of prior day each day is a new day , todays and yesterdays upper value is 1.3612 . Now if Sundays / Monday price moves away from this then it is a bullish...
Ignored
Ok thanks. look back 1 post left chart line chart of dow. no indies just price action.
Before Forex I was tall, and clean shaven. Now I am an Ewok.
note how the bulk of the volume profiles have been in the 1.3600 to 1.3500 area ? this is due to accumualtion. There really is no selling interest in the high 1.3650 to 1.3800 area .. no buying and no selling .. bulk of volume action is taking place in 1.3500 to 1.3580 zone.
loads of high vol pivots in 1.3550 to 1.3600 area and we just poked above them today
Ignored
Malcolmb,
do you think the trend in the process of changing to upwards? i see what you are saying with volume analysis and it makes perfect sense but i can't understand how correlations would work out djia is at 2009 highs, oil > $80, if eu is just beginning its bullish cycle and old correlations stay, it means DJIA goes to 15,000 and oil back to $150. with current economic environment it is hard to believe.
maybe big volume candles in 1.34-1.35 area just mean that Germany or ECB just defending its currency from disorderly fall? afraid of union breakup?and that defense will lead just to 400-500 pip consolidation? good work. keep it up.
do you think the trend in the process of changing to upwards? i see what you are saying with volume analysis and it makes perfect sense but i can't understand how correlations would work out djia is at 2009 highs, oil > $80, if eu is just beginning its bullish cycle and old correlations stay, it means DJIA goes to 15,000 and oil back to $150. with current economic environment it is hard to believe.
maybe big volume candles in 1.34-1.35 area just mean that Germany or ECB just defending its currency from disorderly fall? afraid of union...
Ignored
The odds are, we're all wrong. Well you may not be, but I trade expecting to be wrong. If it brakes down-----or up. Its not all that important where the market wants to go, the same thing happens. When in a range take profit (bird in the hand $hit), and when it brakes get in on pull backs.
Some times it pays to simplify........ Take profit when the market provides it, and enter again when the market retraces. Yes I'm of the opinion we should see a retrace north, but for now its still a range. I'm sure your doing fine and don't need my impute----- and I'm not really trying to butt in on your posts. I just tagged you because you brought up the range.
The odds are, we're all wrong. Well you may not be, but I trade expecting to be wrong. If it brakes down-----or up. Its not all that important where the market wants to go, the same thing happens. When in a range take profit (bird in the hand $hit), and when it brakes get in on pull backs.
Some times it pays to simplify........ Take profit when the market provides it, and enter again when the market retraces. Yes I'm of the opinion we should see a retrace north, but for now its still a range....
Ignored
Hey Knuckle
Most likely we are all wrong lol.
I don't know other method to play this market than the trend following. And this puppy now showing all the signs that it wants to reverse big time, hence the most dangerous situation for my kind of trading with potentially big big losses.
As I understand from your post, you play ranges?
GL and happy weekend.
do you think the trend in the process of changing to upwards? i see what you are saying with volume analysis and it makes perfect sense but i can't understand how correlations would work out djia is at 2009 highs, oil > $80, if eu is just beginning its bullish cycle and old correlations stay, it means DJIA goes to 15,000 and oil back to $150. with current economic environment it is hard to believe.
maybe big volume candles in 1.34-1.35 area just mean that Germany or ECB just defending its currency from disorderly fall? afraid of...
Ignored
I do not get it either .. just going by what the volumes are saying on weekly charts .. and i can show time and time again these are not often wrong as these kind of volumes we are seeing on both gu and eu futures do not rarely happen
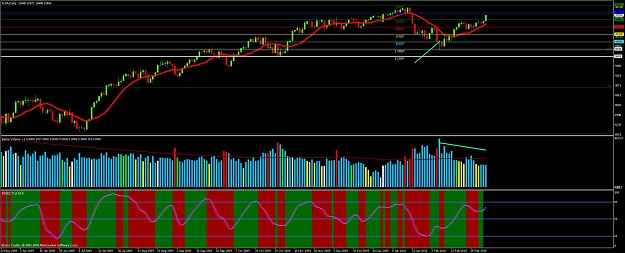
then I looked at dj and spotted this ....symmetry ... if this move is mirror image of 8000 move we could see 12500 dj
remember what is better .... zero return on money in bank or borrow usd and get dividends of 6% on some stocks , with borrowing so low.
on that last dip in the markets the likes of gs , cat etc were gobbled up on the dip . There is no shortage of willing buyers in the stocks market. This last week every bad news dip on the es has been bought. Until i see different intra day behavior on es I will be thinking we break out of 2009 highs
from a fundies stand points this makes no sense .. none at all.
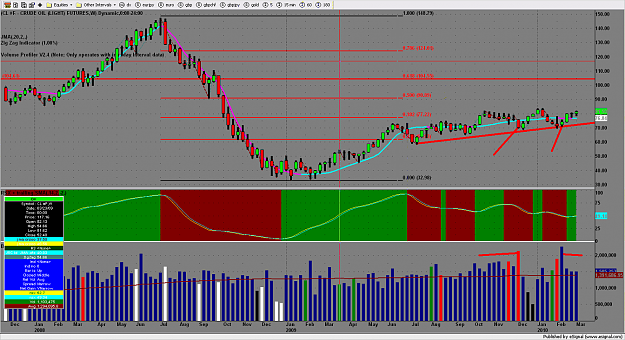
oil .. well weekly says it all ... massive accumulation at 70 ... this is all starting to make sense on charts ... yet not when thinking about state of economy
I do not get it either .. just going by what the volumes are saying on weekly charts .. and i can show time and time again these are not often wrong as these kind of volumes we are seeing on both gu and eu futures do not rarely happen
then I looked at dj and spotted this ....symmetry ... if this move is mirror image of 8000 move we could see 12500 dj
remember what is better .... zero return on money in bank or borrow usd and get dividends of 6% on some stocks , with borrowing so low.
on that last dip in the markets the likes of gs , cat...
Ignored
My view was that DJIA is about to find its top (right now probably it's coming to make double top), oil on dailies possible triple top and all this made perfect sense for EU downtrend continuation with break of 2008 lows, But now I'm confused...