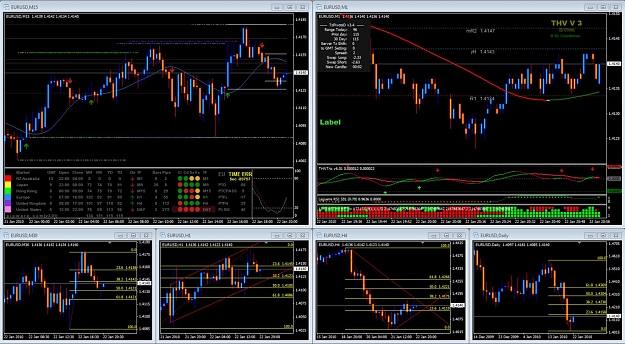
Here is my latest rainbow template. I replaced the MAs which were only approximate with the T3 5m and T3 15 min indies that someone kindly shared. These replicate the higher tf corals more accurately on the 1m chart.
I also redid the colors (this rainbow is named after Bemac because he was the first one to think of using variable MAs - brilliant idea but the original color scheme was really ugly), and I changed some of the lower MAs to be more like the Guppy MAs so you can see the turn better. The dark gold is like the fast guppy and the green between the blue lines is like the slow guppy. The light gold is like the distance between the fast and slow guppies( so you can gauge how it is behaving). This is approximate because these MAs are not exactly like the guppies, but I find this setup as useful as the guppies, maybe even more so because of how the VarMAs behave.
About the entries on that post - yes, that was not coincidental. Those were the 6 point entries.
If you take the 6 point entries, you are getting in when the 1m fast trix and the 5m fast trix have just changed color. You will usually get good trend entries if you also take only the 6 point entries that
- are in line with the Rainbow direction (i.e green entries when rainbow is going up, red when it is going down).
- are the first one or two waves of the 1m fast trix after the 5m fast trix has just changed color
-have a nice indentation of the rainbow (retrace) with reasonably moderate price bars forming a nice arch or double arches at that point.
- are free of divergence on the previous peak or forming divergence
If I want to do countertrend divergence trades I also look at the state of the rainbow. That is, I will only do these trades when the rainbow is either choppy or near the end of the daily range or a major support resistance AND also is very over extended.
The conclusion I have come to is that contrary to how it feels when you are doing it, you are really safest trading at the extremes. That is, you are safest trading when the rainbow has compacted and is just coming out of an arch, as long as you are trading in the direction of the trend and catching a new wave.
Or you are the safest trading when there is a divergence and the rainbow has been extremely overextended, and is starting to contract away from whatever support or resistence caused the divergence. This is a lot tricker though because you have to be careful not to do this in a strong trend. You always know how far the rainbow can contract (that is it can contract right back to the middle and even if you misjudged and price overshoots and the rainbow flips as though to start a trend on the other side when it gets that compressed it will usually chop around and touch the middle again at least once before it takes off so you can get out) but you never know how far it can extend. As tempting as it is to call the bottom, you can be right only once, and wrong with each new wave down. Whereas if you are trading price coming out of a contraction of a wave in the direction of the trend you can be right many times (with each new higher or lower wave) and wrong only once. Therefore to trade countertrend you need a good reason.
About fibs, I know that the fib on the last swing down on the weekly works really well so far. About the daily ones what I do is put a likely looking one on my chart and then I watch to see what happens. If it provides support resistance for a few tests and retest then I know I got it right (saw what the majority did) and I can use it for the future (until it wears out of course). I've posted two that seem to be working well now in my recent posts.
DislikedHi MissPips - I'm just reading back through your posts in order to gain from your wisdom. I'm wondering which MA's on the template represent the 15m coral and the 30m coral? I'm using the Rainbowanalysis3a template.
Perhaps if you wouldn't mind sharing your latest template that would be great - I notice you've rearranged it a bit and have changed the colours of some of the MAs to make it easier to read.
Thanks again!
Edit: Actually the MAs on my template don't seem to line up with yours. The rainbow looks quite a bit different for...Ignored
Attached File(s)