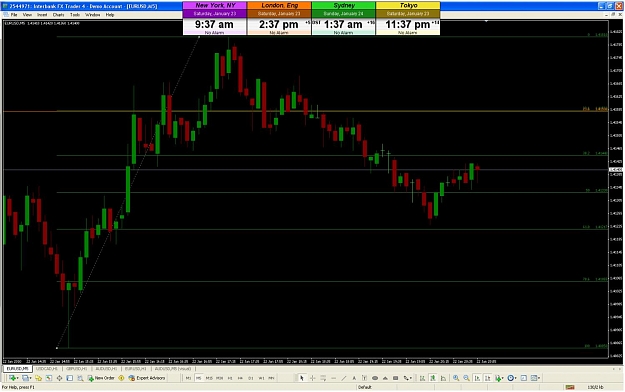
Insomniacs do all kinds of goofy stuff while the world sleeps! I couldn't sleep last night, so I backtested with VHands until my eyes bled, then I found this nifty world clock to stick on my trading screen. Kinda neat, huh?
ed
ed
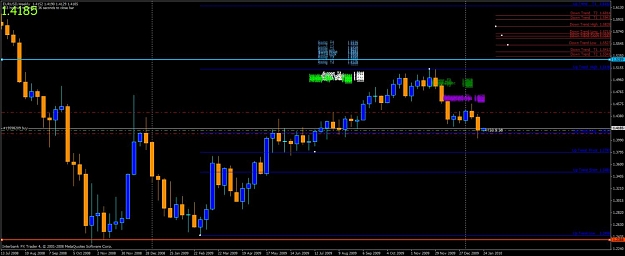
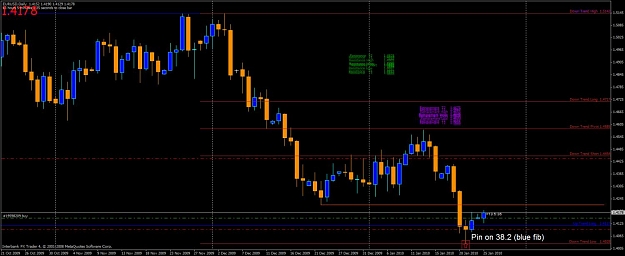
Attached Image (click to enlarge)