• Home
  • Forums
  • Trades
  • News
  • Calendar
  • Market
  • Brokers
  • Login
  • Join
  • 3:02pm
Menu
  • Forums
  • Trades
  • News
  • Calendar
  • Market
  • Brokers
  • Login
  • Join
  • 3:02pm
Sister Sites
  • Metals Mine
  • Energy EXCH
  • Crypto Craft

Options

Bookmark Thread

First Page First Unread Last Page Last Post

Print Thread

Similar Threads

Free flexible COT Index! 4 replies

How to free indicator resources? indicator called from EA 6 replies

Indicator free system 32 replies

COT as indicator? Dollar Index??? 3 replies

Free COT report 9 replies

  • Trading Systems
  • /
  • Reply to Thread
  • Subscribe
  • 78
Attachments: COT trading system with free indicator
Exit Attachments
Tags: COT trading system with free indicator
Cancel

COT trading system with free indicator

  • Last Post
  •  
  • Page 1 23456 15
  • Page 1 234 15
  •  
  • Post #1
  • Quote
  • First Post: Edited May 25, 2015 5:29am Oct 21, 2014 5:08am | Edited May 25, 2015 5:29am
  •  sym
  • Joined Apr 2011 | Status: Working... (too much) :) | 356 Posts
Hi All,

Before starting let me make this very clear:
1 - I'm not here to teach anything to anybody
2 - this thread is NOT for scalper, day traders or fast money people
3 - this thread is for sharing tool and ideas in order to try to improve trading and knowledge
4 - If you agree, welcome.

my name is Sym and I'm a trader and a coder.
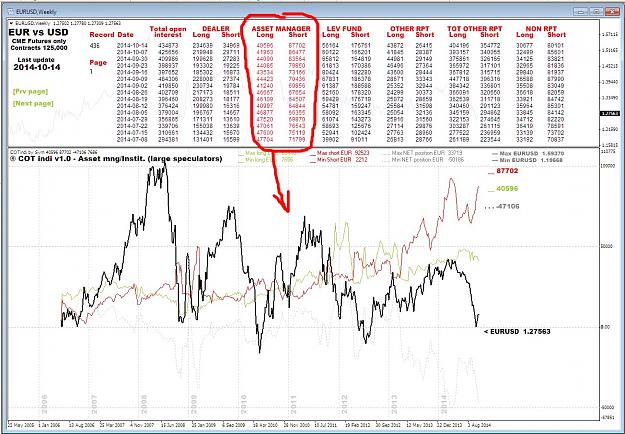
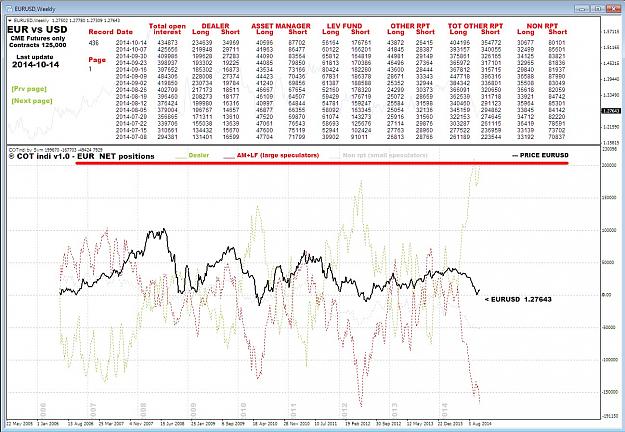
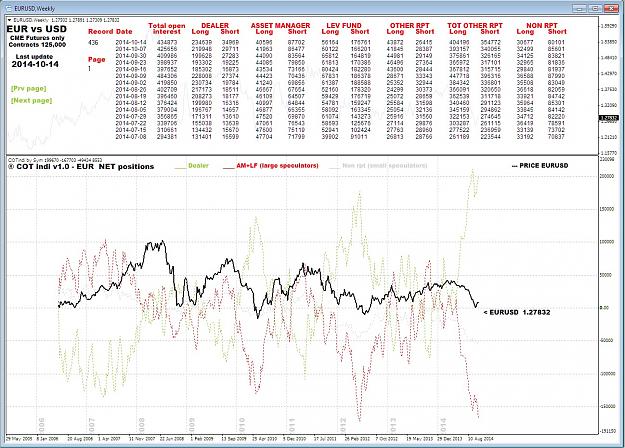
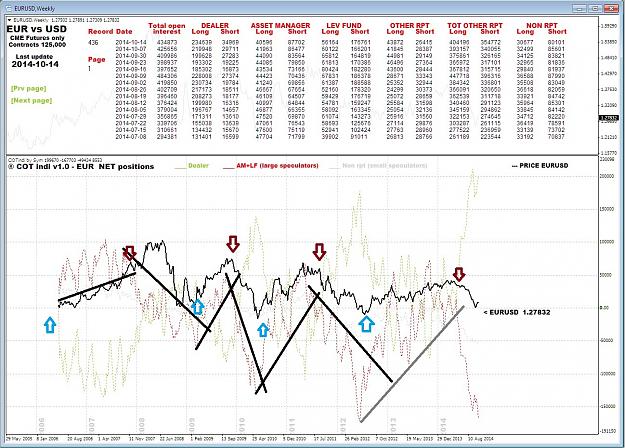
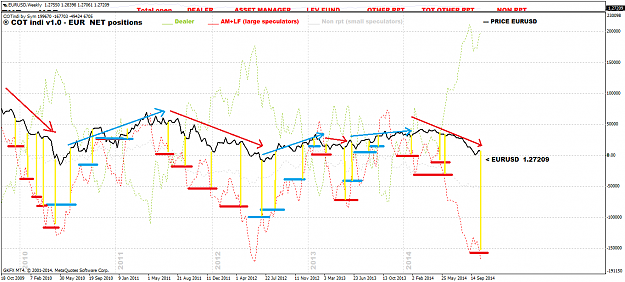
Time ago I felt something was missing on the web. I needed a tool for my trading decisions. For this reason I decided to code an indicator.
And now this indi is going to be shared with you. It cost me a big amount of time and efforts and I'm also thinking about possible improvements and developments... for these reasons (and others) please don't ask for MQL code.
Enjoy the indicator. My commitment is to keep the weekly data up to date, explain how it works and give some hints.
Nothing more and nothing less.


EDIT 10-2-2015: "HOW TO"
--------------------------------------------------------------------------------------------
because COT indicator has been changing, below you'll find a PDF guide
in order to summarize and better explain his functions and use.
Hope to have done good !!! Enjoy and let me know.
--------------------------------------------------------------------------------------------


COTindicator 1.9 http://tinyurl.com/ox3hxhp


COT FILE 19-5-2015 http://tinyurl.com/oe4yvzq
--- nothing to say ---
  • Post #2
  • Quote
  • Edited Oct 22, 2014 1:56am Oct 21, 2014 5:21am | Edited Oct 22, 2014 1:56am
  •  sym
  • Joined Apr 2011 | Status: Working... (too much) :) | 356 Posts
Using COTIndi by Sym it's easy.
The only main indicator entry is: SHOWDATA (from 1 to 7) - picture 3

- input 1: DEALER (picture 1 - opened long and short futures contracts). The numbers under DEALER are RED colored, this means the line chart below is drawn by these numbers In the upper side of section 2 (see picture 1) there are: MAX and MIN opened LONG POSITIONS (from 2006 till today, the numbers will be only positive), MAX and MIN opened SHORT POSITIONS (from 2006 till today, the numbers will be only positive), MAX and MIN opened NET POSITIONS (from 2006 till today, the numbers can be positive or negative), MAX and MIN weekly price closure (from 2006 till today).
DEALER are large company who trade "futures" in order to protect their products/goods from big movements in the forex market. They usually are on the wrong side of the market.
- input 2 and 3: (picture 2) ASSET MANAGER and LEVERAGED FUND (opened long and short futures contracts). The numbers under ASSET MNG or LEV FUND are RED colored, this means the line chart below is drawn by these numbers. In the upper side of section 2 (see picture 1) there are: MAX and MIN opened LONG POSITIONS (from 2006 till today, the numbers will be only positive), MAX and MIN opened SHORT POSITIONS (from 2006 till today, the numbers will be only positive), MAX and MIN opened NET POSITIONS (from 2006 till today, the numbers will be positive or negative), MAX and MIN weekly price closure (from 2006 till today).
ASSET MANAGER and LEVERAGED FUND are the "big boys". The "Market Makers" who move the prices as they wish. We must take care where they are, when and at what price levels they had bought or sold. We can't predict what they will do next week, but if they are full of BUY contracts from long time, perhaps it's time for us to built SELLING PYRAMIDE. Vice versa if they are FULL of SELL contracts, we may consider to start buying.
- input 4 e 5: are not too much relevant, but they are in the COT report.
- input 6: NON REPORTABLE. These are small traders/speculators. Many time the majority of them is on the wrong side of the market.
- input 7: (picture 4) the last but not least important: this entry shows the 3 most important NET POSITION category at a glance. You can see DEALER/COMMERCIALS (green dotted line - wrong position on the market) - ASSET MNG + LEV FUND (red dotted line - big speculators, banks, leveraged funds, central banks - they are almost always on the right side of the market. Try to stay with them or understand what they are doing) - NON RPT (gray dotted line - small speculators. They usually are late trying to follow the MM.
Black line is the weekly closure price.


Below pictures 2, 3, and 4.
Attached Image(s) (click to enlarge)
Click to Enlarge

Name: 2.jpg
Size: 238 KB
Click to Enlarge

Name: 6.jpg
Size: 286 KB
Click to Enlarge

Name: 7.jpg
Size: 275 KB
--- nothing to say ---
 
 
  • Post #3
  • Quote
  • Oct 21, 2014 5:23am Oct 21, 2014 5:23am
  •  sym
  • Joined Apr 2011 | Status: Working... (too much) :) | 356 Posts
VERY IMPORTANT TO UNDERSTAND:

as stated before we should try to do what Market Makers do or better (not easy) what they are going to do.
If you note for these pairs:
GBPUSD
EURUSD
AUDUSD
NZDUSD
prices move accordingly (more or less) with the RED line (picture 4)

for these pairs:
USDCAD
USDCHF
USDJPY
it is the opposite (more or less), price move opposite the red line.
--- nothing to say ---
 
 
  • Post #4
  • Quote
  • Edited 6:11am Oct 21, 2014 5:42am | Edited 6:11am
  •  sym
  • Joined Apr 2011 | Status: Working... (too much) :) | 356 Posts
This is today situation on EURUSD

PRICE: from the beginning of March 2014 the EURUSD value went down till nowdays.
From 1.3912 to 1.2783 (weekly closure). It means almost 1,200 pips in 7 months.
Price could go down further to test 2012 low at 1.2159 or deeper to test 2010 low at 1.1966. This means another 800 pips down travel.
It's that movement possible? My answer is YES, it is.
It's that movement probable? Not very much.
And why?
Because large speculators had sold months ago, and sooner o later they'll start closing SELL ORDERS and opening BUY ORDERS.
That could happen next week or next month or in a larger period. But for sure it will happen.
So I could start now to buy small lots every 50-100 pips. All I need is an account that can substain 800 pips of DD without any sufference.
My target will be at least 800-1000 pips with 5-7 winning orders in a few months.
Attached Image (click to enlarge)
Click to Enlarge

Name: today.jpg
Size: 276 KB
--- nothing to say ---
 
 
  • Post #5
  • Quote
  • Oct 21, 2014 10:16am Oct 21, 2014 10:16am
  •  Phoenix.fx
  • | Joined Oct 2014 | Status: Member | 42 Posts
Nice, I will follow your thread. Would you mind adding some entries in order to illustrate your thoery? Thanks
 
 
  • Post #6
  • Quote
  • Oct 21, 2014 12:32pm Oct 21, 2014 12:32pm
  •  4xplosion
  • | Joined Oct 2007 | Status: Member | 447 Posts
Nice....
 
 
  • Post #7
  • Quote
  • Oct 21, 2014 1:09pm Oct 21, 2014 1:09pm
  •  kraven
  • Joined Apr 2010 | Status: happy as a pig in shit. | 1,448 Posts
Sym thank you for your excellent work, effort and generosity in sharing. will be following as i have an interest in COT reports.

A 2 minute examine of the last chart Sym posted should show long term trades how useful it could be with simple TL analyses of ASSET MNG + LEV FUND (red dotted line)
Attached Image (click to enlarge)
Click to Enlarge

Name: today.jpg
Size: 417 KB
 
 
  • Post #8
  • Quote
  • Edited Oct 22, 2014 1:59am Oct 21, 2014 1:15pm | Edited Oct 22, 2014 1:59am
  •  sym
  • Joined Apr 2011 | Status: Working... (too much) :) | 356 Posts
Quoting Phoenix.fx
Disliked
Nice, I will follow your thread. Would you mind adding some entries in order to illustrate your thoery? Thanks
Ignored
Hi Phoenix, thanks... but I didn't invent anything. COT trading is a way of trading many people use.
There are COT indicators and sevices releasing COT data on payment.
So, nothing new. What was missing, was something free. And here we are.

Up above you see (on post 4) one suggestion of mine . That could be a good start on EURUSD.

I'll post something else using the indicator.

Have a nice day
--- nothing to say ---
 
 
  • Post #9
  • Quote
  • Oct 21, 2014 1:16pm Oct 21, 2014 1:16pm
  •  sym
  • Joined Apr 2011 | Status: Working... (too much) :) | 356 Posts
Quoting 4xplosion
Disliked
Nice....
Ignored
Thanks
--- nothing to say ---
 
 
  • Post #10
  • Quote
  • Edited Oct 22, 2014 1:49am Oct 21, 2014 1:20pm | Edited Oct 22, 2014 1:49am
  •  sym
  • Joined Apr 2011 | Status: Working... (too much) :) | 356 Posts
Quoting kraven
Disliked
Sym thank you for your excellent work, effort and generosity in sharing. will be following as i have an interest in COT reports. A 2 minute examine of the last chart Sym posted should show long term trades how useful it could be with simple TL analyses of ASSET MNG + LEV FUND (red dotted line) {image}
Ignored
Hi Kraven

thanks a lot for your analisys... The indi is new and I didn't had time to analize all aspects and implementions.
That because I chose to share it. More heads are better then one.
So thank you, I like this new trading approach and I think is pretty original.
Something to work with...
--- nothing to say ---
 
 
  • Post #11
  • Quote
  • Oct 21, 2014 5:46pm Oct 21, 2014 5:46pm
  •  billbss
  • Joined Apr 2006 | Status: Member | 4,301 Posts
Great thread, Sym.
Thanks for sharing your hard work.
I hope your thread gets the attention it deserves.
 
 
  • Post #12
  • Quote
  • Oct 21, 2014 5:58pm Oct 21, 2014 5:58pm
  •  hannele
  • Joined Sep 2012 | Status: Member | 210 Posts
Hi Sym,

thank you for sharing your work. I am looking forward following your thread with great interest.

cheers
hannele
 
 
  • Post #13
  • Quote
  • Oct 21, 2014 10:06pm Oct 21, 2014 10:06pm
  •  MarketFox
  • Joined Jul 2014 | Status: Capitalism's Mercenary | 91 Posts
Hi, Sym.

This is AWESOME! I was working in something similar to this, but this is even better.
The COT is the deepest data you can have in Trading.

Suscribed and following with interest!

Keep it up and stay green.
MarketFox.-
Trade, don't bet.
 
 
  • Post #14
  • Quote
  • Edited 11:27pm Oct 21, 2014 10:13pm | Edited 11:27pm
  •  kraven
  • Joined Apr 2010 | Status: happy as a pig in shit. | 1,448 Posts
Quoting sym
Disliked
{quote} Hi Kraven thanks a lot for your analisys... The indi is new and I didn't had time to analize all aspects and implementions. That because I chose to share it. More heads are better then one. So thank you, I like this new trading approach and I think is pretty original. Something to work with...
Ignored
No problem Sym, infact i've had time to load this excellent piece of work and believe the best way to use this is on breakouts. I'm big on breakouts and fakeouts and use them in my trading......... http://www.forexfactory.com/showthread.php?t=500860

However i've noticed if you look at the AM LF line you get very few fakeouts, only breakouts. I believe taking these breaks could be a good way to trade (see pic)

Attached Image (click to enlarge)
Click to Enlarge

Name: EURUSDWeekly.png
Size: 69 KB


You could even use this method and incorporate daily entries if the day is moving in the same direction as the breakout, choosing your preference to enter (eg inside bars, pin bars, ma crosses etc). this way you build a millipede.


.......and for those asking Sym for trading examples and what to do next? I believe that's what he's here for, correct me if i'm wrong Sym. He's created this excellent piece of coding, now he's after help and suggestions for it's best use.
 
 
  • Post #15
  • Quote
  • Oct 21, 2014 10:24pm Oct 21, 2014 10:24pm
  •  kraven
  • Joined Apr 2010 | Status: happy as a pig in shit. | 1,448 Posts
Sym how does it keep the weekly data upto date? does this update automatically?
 
 
  • Post #16
  • Quote
  • Oct 21, 2014 10:50pm Oct 21, 2014 10:50pm
  •  Relativity
  • Joined Feb 2011 | Status: Crystal Jade Per Day Trader | 397 Posts
I...
Like this.
Really

=)
 
 
  • Post #17
  • Quote
  • Oct 21, 2014 11:21pm Oct 21, 2014 11:21pm
  •  Rahimseven
  • | Additional Username | Joined May 2011 | 223 Posts
Thanks SYM!!!


This is a thing of beauty!
 
 
  • Post #18
  • Quote
  • Oct 21, 2014 11:27pm Oct 21, 2014 11:27pm
  •  muhitalam
  • | Commercial Member | Joined Oct 2014 | 86 Posts
Hello sym,

Thank you for this excellent thread. I like this & I will follow this. As i am new trader I have one question ; Does this keep weekly data up-to date automatically ? Very much looking forward to hearing from you
 
 
  • Post #19
  • Quote
  • Oct 21, 2014 11:47pm Oct 21, 2014 11:47pm
  •  pakeha
  • | Joined Sep 2011 | Status: Member | 431 Posts
I suspect you would need to load the report file each week
 
 
  • Post #20
  • Quote
  • Oct 22, 2014 1:08am Oct 22, 2014 1:08am
  •  FX-Jay
  • Joined Sep 2014 | Status: Member | 555 Posts
Great thread!!

So generous of you SYM to be sharing your hard work for others to profit.

COT analysis has been my 'thing' for quite some years now, and it almost never failed me. Its just the time factor that is always off, but it is the perfect tool for position traders (which most members on FF aren't).

I totally agree with your views on EU, we're going to see 1.32-1.33 before the end of the year whether Draghi likes it or not.
Euro small speculators (i.e. retailers) are at all time extreme shorts (these are the real retail figures to look at btw - not the FF positions tool that is based on 200 traders mostly on demos). In addition USD commercial +large speculator positioning is also at all time extremes.

When I said my targets few weeks back, most people laughed. Well few weeks later, we started hearing about delaying interest rate hikes in the US + possible QE4, coincidence?! Now less people are laughing I guess

QE or no QE, the trend in the USD is about to change and most probably all the people laughing now will be on the wrong side of the trade.
Those are the same ones that were calling for $3,000 gold when it was @ $1,900 & 1.9 GU when it was @ 1.71 & $150 oil when it was @ $105 eventhough the COT was clearly pointing for the right direction weeks in advance.
So for whoever is calling for EU to be below 1.2 in the near future, I can't but wish you luck.

Best,
Jay
 
 
  • Trading Systems
  • /
  • COT trading system with free indicator
  • Reply to Thread
    • Page 1 23456 15
    • Page 1 234 15
1 trader viewing now
  • More
Top of Page
  • Facebook
  • Twitter
About FF
  • Mission
  • Products
  • User Guide
  • Media Kit
  • Blog
  • Contact
FF Products
  • Forums
  • Trades
  • Calendar
  • News
  • Market
  • Brokers
  • Trade Explorer
FF Website
  • Homepage
  • Search
  • Members
  • Report a Bug
Follow FF
  • Facebook
  • Twitter

FF Sister Sites:

  • Metals Mine
  • Energy EXCH
  • Crypto Craft

Forex Factory® is a brand of Fair Economy, Inc.

Terms of Service / ©2023