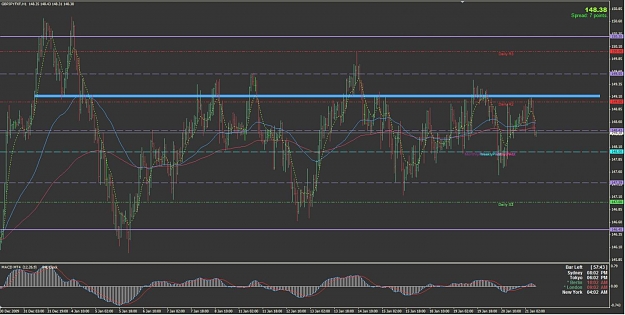
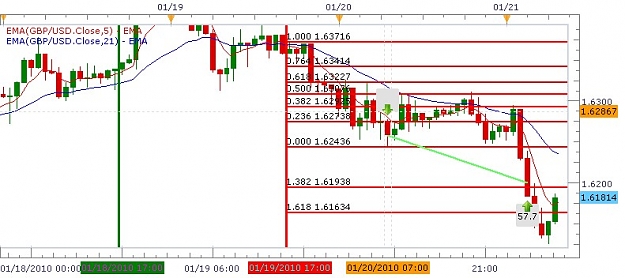
DislikedIt's a long ways down to 138. Got a few pips protected. Gonna let it ride. Let's see what happens.
BartstopIgnored
 Indicator Free Trading - Skunny
- #5,664
- Edited 2:17pm Jan 20, 2010 2:04pm | Edited 2:17pm
- Joined Jul 2009 | Status: symbol | 1,549 Posts
Keep smiling 
- #5,674
- Jan 21, 2010 1:04am Jan 21, 2010 1:04am
- Joined Sep 2008 | Status: Trader | 2,298 Posts
Starting to see instead of just looking.

- #5,676
- Jan 21, 2010 1:56am Jan 21, 2010 1:56am
- Joined Sep 2008 | Status: Trader | 2,298 Posts
Starting to see instead of just looking.
- #5,680
- Jan 21, 2010 6:16am Jan 21, 2010 6:16am
- Joined Jul 2009 | Status: symbol | 1,549 Posts
Keep smiling