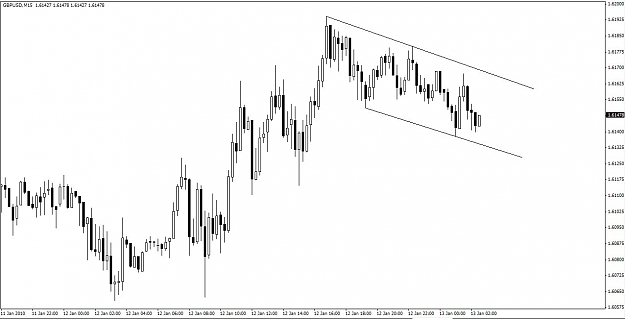
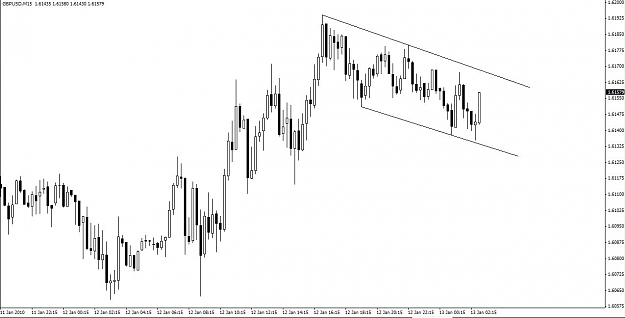
DislikedShort GU at 1.6149 exactly.
SL 1.6181
TP1 1.6099
TP2 1.6065
These may change as I may elect a trailing stop rather than fixed targets.Ignored
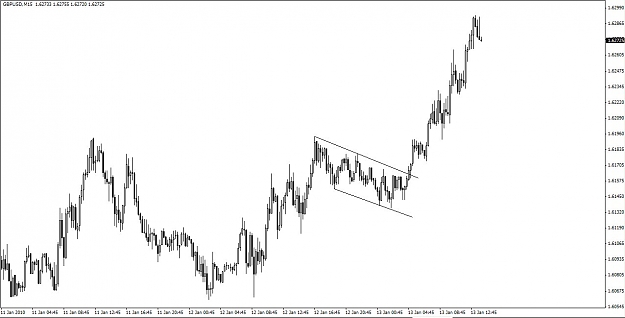
Anyway, if GU goes up, this is how I see it using FEs, which in this case have the 100 and 262 levels aligning very well with major S&R lines off the H4 chart (light red/green lines). If it goes down, using a broader span FE, the 262 level aligns with the third green S&R line down on the H4 chart (a 300+ pip run that might take two sessions).
Attached Image(s) (click to enlarge)