UJ Long Possibility:
Yesterday it first seemed inching towards a short, but the closer to FO the more it looked like a long trade possibility. Yeah, it went up, but only a head fake amount, and then plummeted.
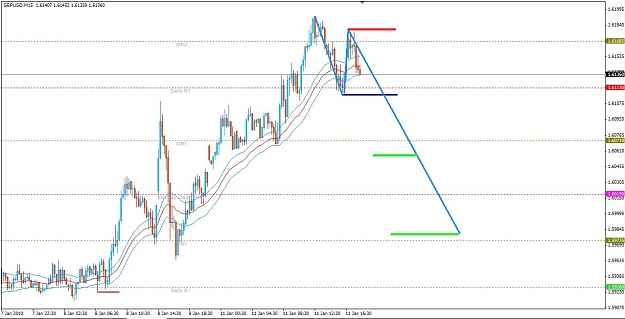
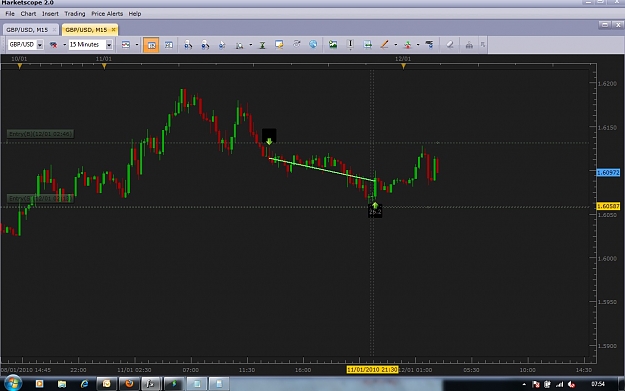
Ok, so now it looks like a long trade possibility. PA is back to the proverbial 92.20s barrier and now we need a pullback to/into or thru Dragon to establish the current high area as Ep long area (first chart).
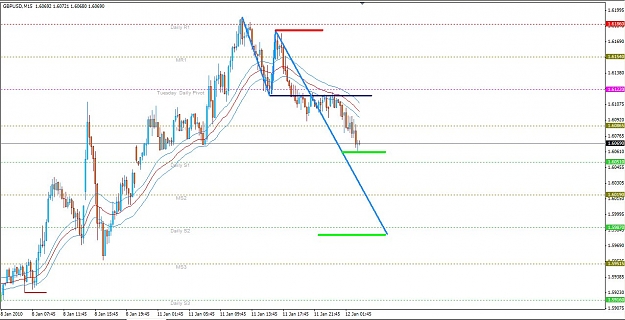
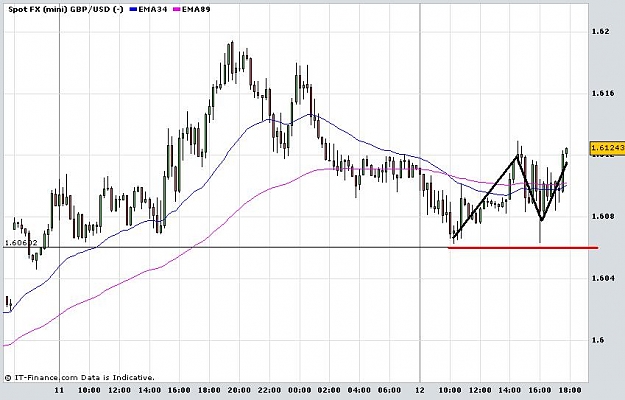
Edit: Well! THAT (second chart) certainly was a pullback to/into/thru and......... BEYOND! Relative trading activity is well increased in this 92.05 +/- 20 pips area. Considering H4 (third chart), this could be "accumulatiion" in preparation for a bounce up off of the S&R area (black line). But, it is speculation based only on my interpretation of the trade counts and the possibility that the professional asian session trading firms wanted the price back down so they too could go long at the lows of the prior session. PA could go either way, at any time. And, as we have just seen........FAST.
Yesterday it first seemed inching towards a short, but the closer to FO the more it looked like a long trade possibility. Yeah, it went up, but only a head fake amount, and then plummeted.
Ok, so now it looks like a long trade possibility. PA is back to the proverbial 92.20s barrier and now we need a pullback to/into or thru Dragon to establish the current high area as Ep long area (first chart).
Edit: Well! THAT (second chart) certainly was a pullback to/into/thru and......... BEYOND! Relative trading activity is well increased in this 92.05 +/- 20 pips area. Considering H4 (third chart), this could be "accumulatiion" in preparation for a bounce up off of the S&R area (black line). But, it is speculation based only on my interpretation of the trade counts and the possibility that the professional asian session trading firms wanted the price back down so they too could go long at the lows of the prior session. PA could go either way, at any time. And, as we have just seen........FAST.
Attached Image(s) (click to enlarge)