Hi Stewrigh,
Thought I would put in my views on the chart you posted. I agree with your conclusion of: More PA info is needed.
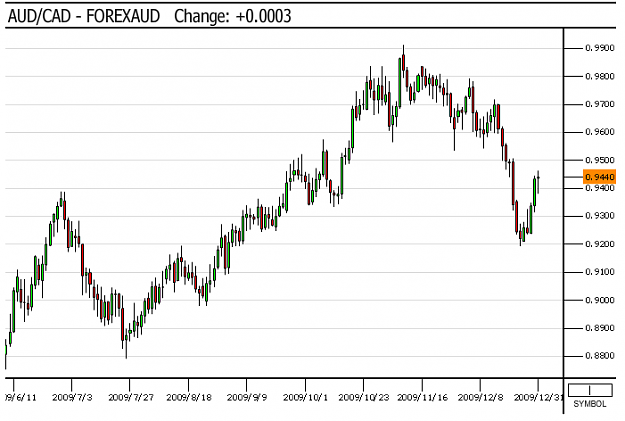
I am curious...The last candle ... was that closed without a regular full day of trading? Obviously have the LL LH giving you information. Definitely indecision of buyers/sellers on the doji.
Something I look at: Look at the range of price from swing lows to the trend line. Measure several of these moves going back in the past. Are the ranges of these moves similar? For example on this chart, maybe 225 pts? Now compare that number to the range of the last move up ? Just one more bit of info .
Let us know what happens on Mon/Tues.
Thought I would put in my views on the chart you posted. I agree with your conclusion of: More PA info is needed.
I am curious...The last candle ... was that closed without a regular full day of trading? Obviously have the LL LH giving you information. Definitely indecision of buyers/sellers on the doji.
Something I look at: Look at the range of price from swing lows to the trend line. Measure several of these moves going back in the past. Are the ranges of these moves similar? For example on this chart, maybe 225 pts? Now compare that number to the range of the last move up ? Just one more bit of info .
Let us know what happens on Mon/Tues.
Attached Image