Keyser,
I don't have access to my own charts at the moment so am relying on the chart you posted.
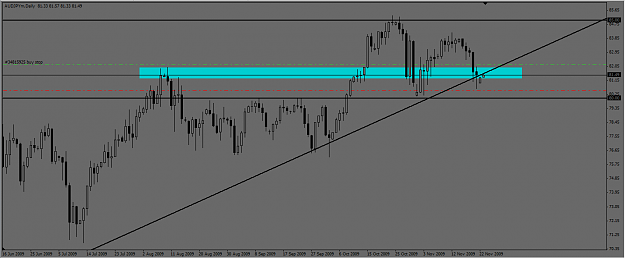
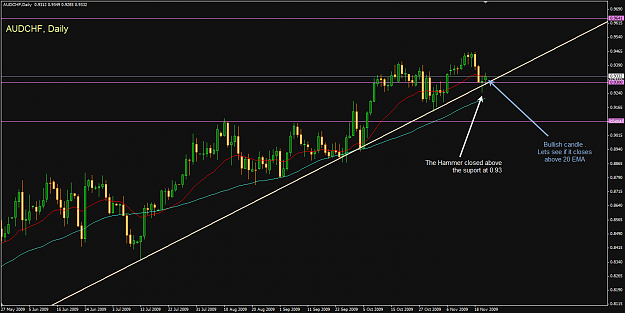
Well, not much of a trend but the last 8 days or so on your chart have LHs and LLs (mostly) which is why you have drawn a short TL there.
I agree, the penultimate candle on your chart is a better hammer shape although in terms of position it does not close at the Low but at the High. The last candle is 'moving towards' being a hammer. Not a pure one I agree.
But it closes on the UP TL you have drawn and the shadow is on the 50MA
Possibly, but also it doesn't make me right either! That's the way with trading, nothing is 100% certain. It is all a question of probabilities!!
Strat may well shoot me down on this...... so ..................!
I don't have access to my own charts at the moment so am relying on the chart you posted.
DislikedDo you consider that a hammer?
Here are Steve Nison's criterias on how to recognize a hammer:
1. The real body is at the upper end of a trading range. As we agreed, the worker is trapped into a channel, we don't have a trendIgnored
QuoteDisliked2. A long lower shadow should be twice the height of the real body. In our case, the real body is bigger than the shadow.
I agree, the penultimate candle on your chart is a better hammer shape although in terms of position it does not close at the Low but at the High. The last candle is 'moving towards' being a hammer. Not a pure one I agree.
QuoteDislikedAgain, the position of the candle, the shadow didn't test any important support level (1.4715)
But it closes on the UP TL you have drawn and the shadow is on the 50MA
QuoteDislikedAs i said, i'm @ page 76 so i might be wrong with this
Possibly, but also it doesn't make me right either! That's the way with trading, nothing is 100% certain. It is all a question of probabilities!!
Strat may well shoot me down on this...... so ..................!