Sound advice. Thank you, Domas4. You might think it so obvious that it need not have been mentioned, but sometimes so much might be on the mind of the trader, that the obvious is hiding in the closet! Thanks again!
Joined Mar 2008
|
Status: PVSRA with Traderathome
|23,555 Posts
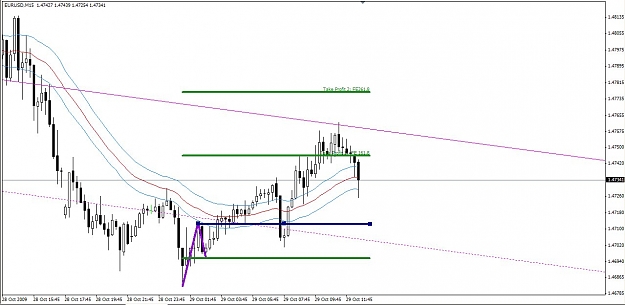
EU M15: You can see they quickly pulled the price down, at which time a good base of trade counts started building. And this has brought the price up around the 89 ema/ DPV area. Perhaps this is where they feel it best to be until the release, since the trade counts have now fallen off, but the price seems to be staying in that area on little interest now.
The high trade count base that started about 40+ pips lower, may be a sign of confidence in an upwards move later, but that is pure speculation. But we can see the price area where the high trade count occurred.
Domas4 is wise in suggesting trades be taken off the table before news releases. Targets on this trade might not be reached by the time the trade should be closed.
Joined Feb 2009
|
Status: Trading in the Zone
|1,766 Posts
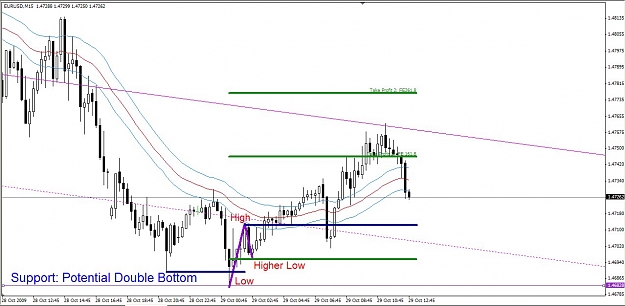
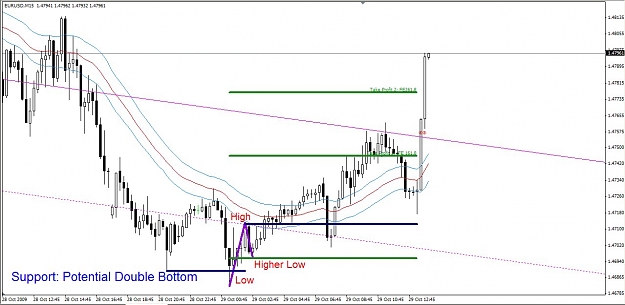
And here is how the advanced SonicR looks:
1) Price reaches potential support and forms a possible double bottom from which to trade - we have a possible low
2) Price rallies toward the dragon (it does not matter whether price reaches the dragon or not - we just need price to retrace at least 50% of the prior swing. In this case, price retraced just over 61.8% of the swing down that carried it into its possible double bottom.
3) Price then retraces at least 38% of that swing up from its low. In this case, price retraced just over 50% of the swing up from the low, and then starts to rally, putting in a potential higher low.
4) Buy stop above the high of the swing up from the low, and use S/R and fib extensions for TP's
It is really all about support and resistance, highs and lows, higher highs and higher lows, lower lows and lower highs.
Do not get confused with the fib retracement stuff. I do not usually measure them myself. I include them here because it shoul help newer traders distinguish a minor wiggle within a swing from separate swings.
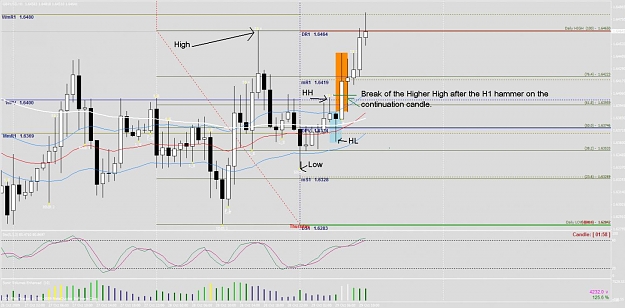
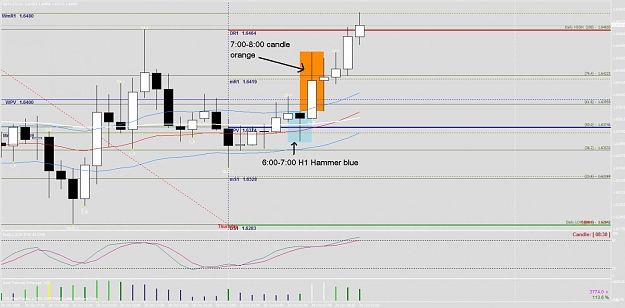
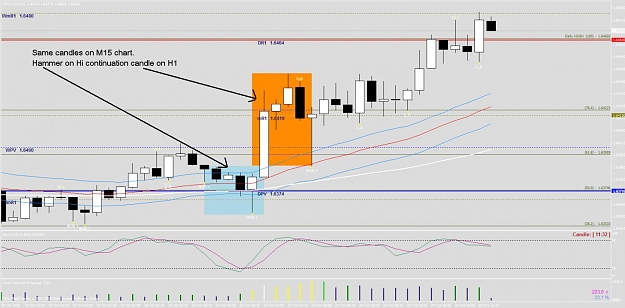
Trading in, i.e. during the formation of a daily bar or a four hour bar - but not after the bar has formed. The 15 minute PA gets you into the market well before a "hammer" or "engulfing candle" on these large time frames has formed. The higher TF bars are the effect, not the cause.
Ignored
Hopefully, D will answer this question but if not SOMEONE PLEASE answer it.
D mentions that the 15 min PA gets us into a trade well before the hammers and like on higher tf and that we are trading the M15 during the formation of a bar on H4, not after it. But, if we look at the bars on the H1 and M15 we can see that before that H1 hammer, there was nothing to trade & the trade came into play at the next candle after the hammer which was the continuation candle.
This is why I can not grasp the idea that DD put forward that we are not trading the continuation candle of the hammers, pinbars etc!
EDIT: Also, how can we know a hammer is going to be a bullish hammer before it completes? It could just as well retrace and became a Bearish engulfing candle?
ddaytrader, what top/bottom range are you using to draw that extension. I am not coming up with those levels.
Ignored
Anchor the fib tool at the 1.4682, second anchor at the 1.4712 swing high, and then pull the third anchor back to the 1.4696 pullback low. Are you pulling the fib tool back and setting the thrid anchor, or are you just planting two anchors and measuring the extensions from the end of the swing instead of from the pullback low?
In my screenshot, the purple lines outline the fib tool anchors.