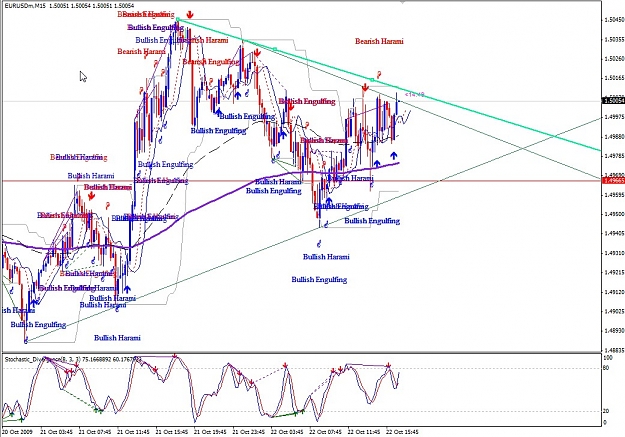
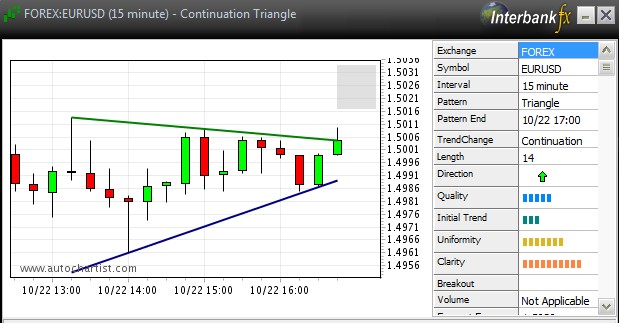
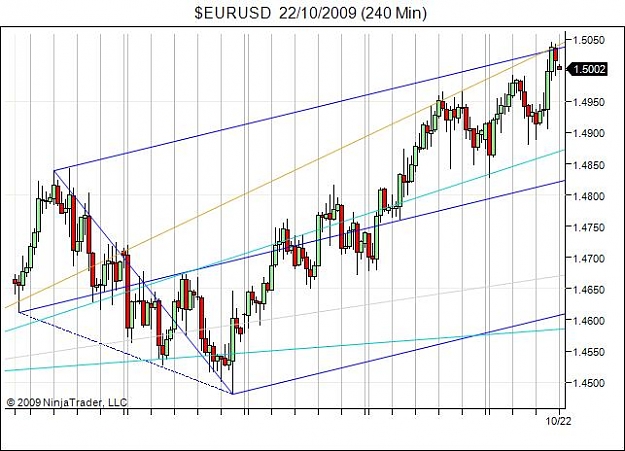
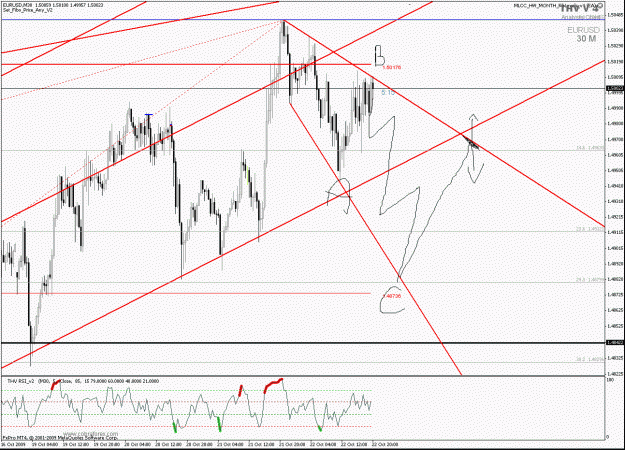
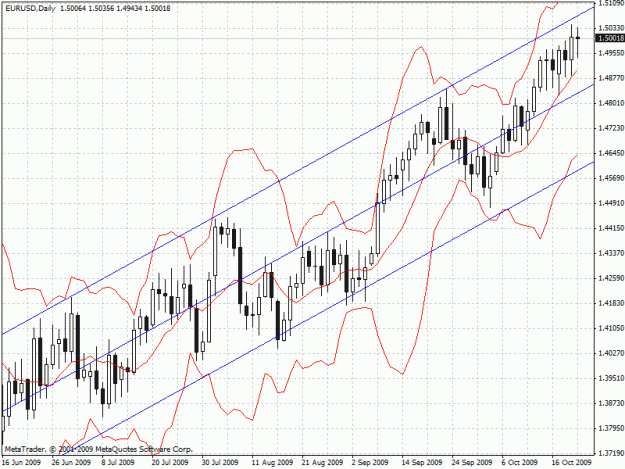
DislikedNice chart. What I see is a symmetric triangle that can break either way. But on the daily picture the action is still bullish, price above 200 and 75 EMA and approaching 161.8 fib of the previous swing. I put a chart to see all I am saying.
The only bias for short is given by the OB state where the stochs reentered on 13.10.2009.
BTW nice shorts but where is your SL?Ignored
Pation is the Holy Grail