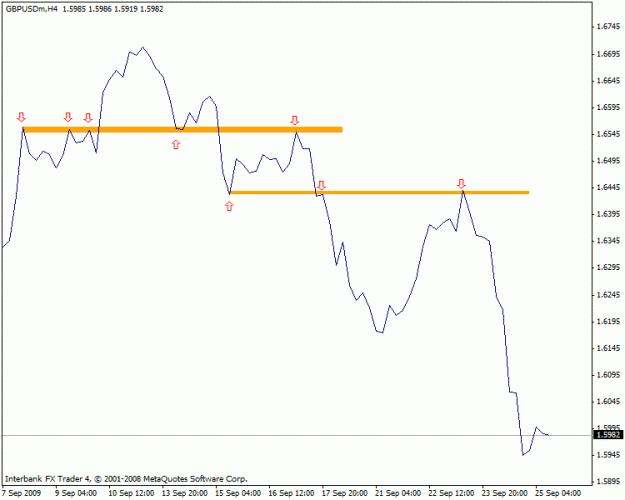
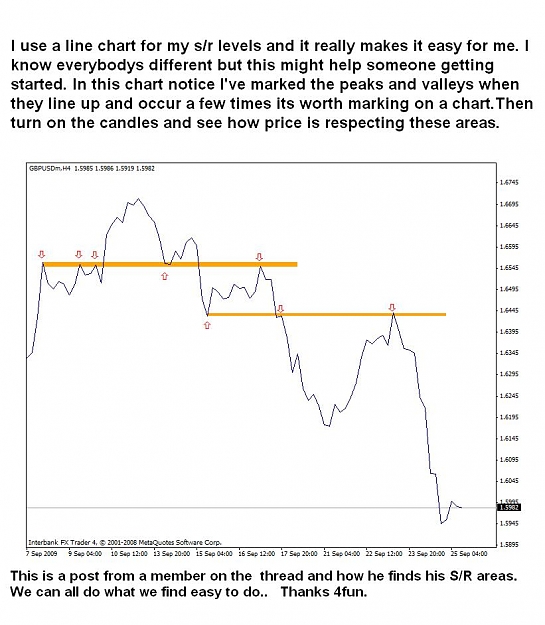
I use a line chart for my s/r levels and it really makes it easy for me. I know everybodys different but this might help someone getting started. In this chart notice I've marked the peaks and valleys when they line up and occur a few times its worth marking on a chart.Then turn on the candles and see how price is respecting these areas.
Ken I sure appreciate and enjoy your post!
Ken I sure appreciate and enjoy your post!
Attached Image (click to enlarge)