Dislikedhttp://fofoa.blogspot.com/2009/06/dead-end.html
Snippet -
'A leveraged system of paper gold forward sales was set up to keep the price of gold (DOWN) under control, so that OTHER people's PHYSICAL gold could be shipped to Arabia at a low DOLLAR price. This would satisfy "the owners of the oil in the ground" and SECURE the "CHEAP flow" of oil to the US who had the SOLE privilege of creating those dollars out of thin air'.
Another interesting article on Dollar Collapse - A Tremendous Secret
http://www.dollarcollapse.com/iNP/view.asp?ID=102
Snippet...Ignored
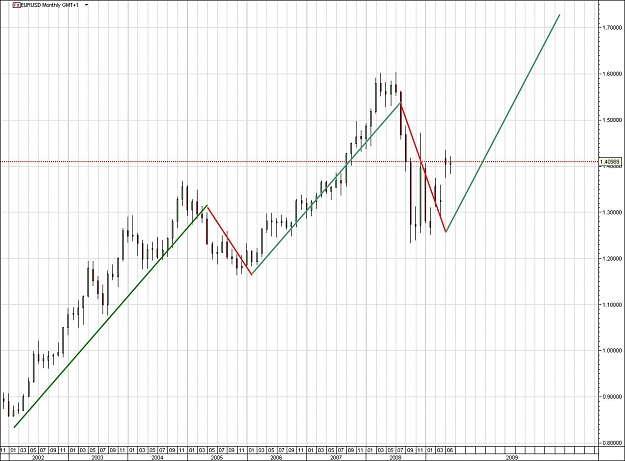
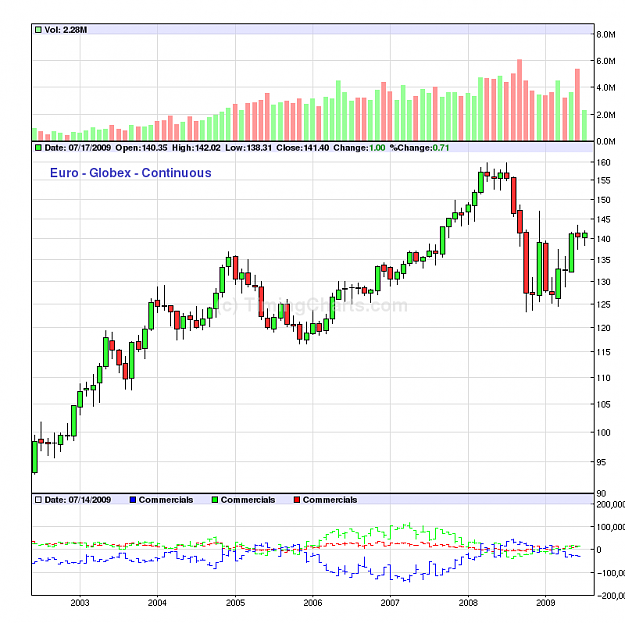
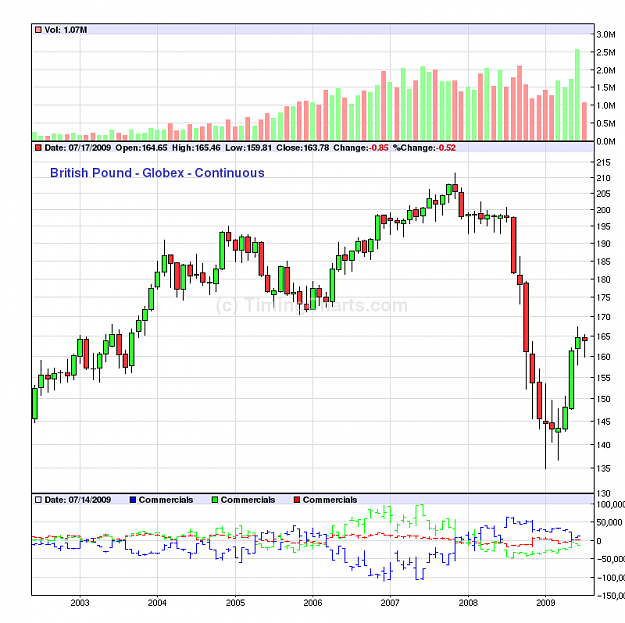
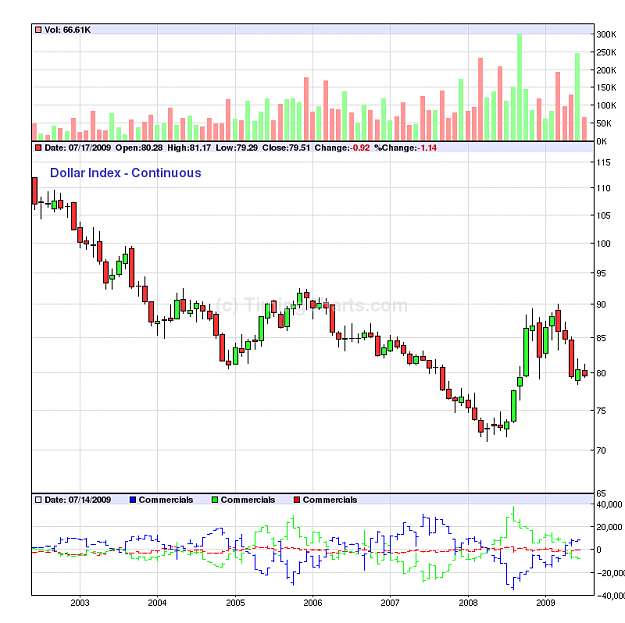
Attached are the dollar, euro and pound futures monthly charts. Interesting thing to note is that last month that was completed we have seen some of the biggest volumes in months/years. Now if we are to analyze what happened there, we must pay attention to the corresponding bar, its size and the close of the monthly price. As we all know from our painful experience price is a derivative from supply and demand in ANY market...shoes, tomatoes, currencies. Now I can already hear somebody saying: "Oh, well forex is not centralized, so you can`t use volume to do any meaningful analysis."
WRONG ! Professional interests/volume is the MAIN and ONLY driver behind price as price moves ONLY "towards the line of least resistance". Oh yeah, there is volume only its computation is different, not to mention there IS valid volume data from futures markets.
Now, if we proceed to our analysis, we can see interesting things happen. The monthly bar on the euro chart shows volume as HIGH as the one before the drop and almost as high during the September drop. If that would have been buyers, why did the candle close like that ? This candle closed as doji = indecision and painfully reminds of the monthly candle that started this whole bull run and the previous one during December. If that were buyers they sure ain`t convincing enough. Candle closed BELOW its open.
Cable`s candle is almost same. Highest volume in YEARS ! On a monthly candle that closed way off its highs and the real body is tiny-itty-bitty-ish. If that were buyers they sure as hell are not convincing at all. Just reeks of hidden selling in the background.
And now for king Dollars`s chart. We have...you guessed it right abnormally high relative volume. On a bullish candle that does not really looks convincing, but if that were sellers why did price close as a bullish candle. Would not they push it way bellow given the volume ?
I don't know guys...I just think someone just started hoarding dollars again. General economic news are overly bullish everywhere, banks coming with record profits just 1 year after this crazy meltdown, just because mark-to-market accounting was taken off the picture ? To cite one of the most able volume traders in this forum and I am not gonna cite his name: "Pros sell on strength and buy on weakness". Strong holders transfer their holdings onto weak holders (us, the retail guys) right at the top which is why you are observing this erratic ranging price action and weak holders sell to strong hands at bottoms during climactic/exhaustion sell-offs
OK...end of rant
p.s. I am not predicting anything...just too many red flags in front of me and only wanted to share with you
Attached Image(s) (click to enlarge)
Thank you Malcolm, Belekas, Jim, raczekfx and Ryanmcd !