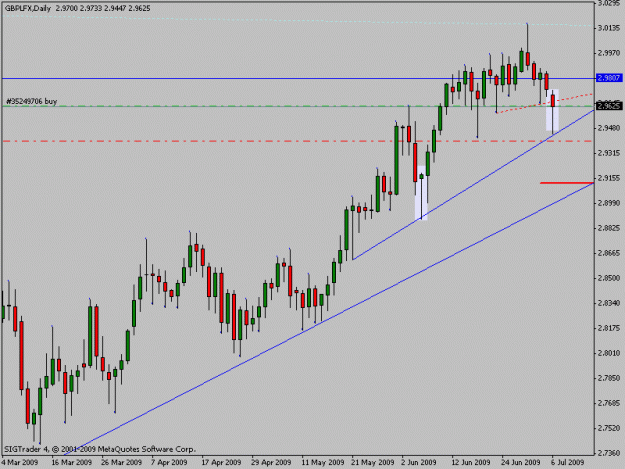
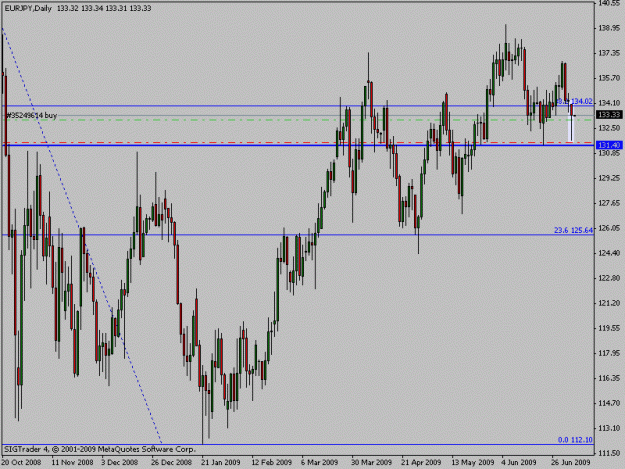
We see candlestick pattern today, which should last minimum for one trading day:
gbp/lfx plus lfx/jpy = geppy is bullish, we see hammer.
If I look correct, geppy has had an downside gap at weekly open,
so in case we have tommorrow a bullish engulfing candle we might see
a morning star. But should be watched tommorrow close, its speculation by now.
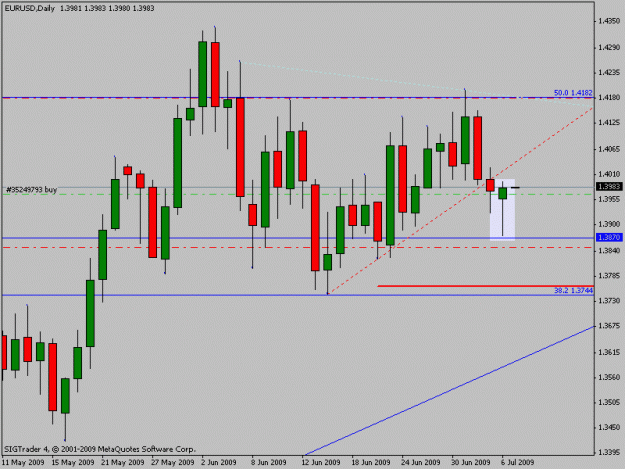
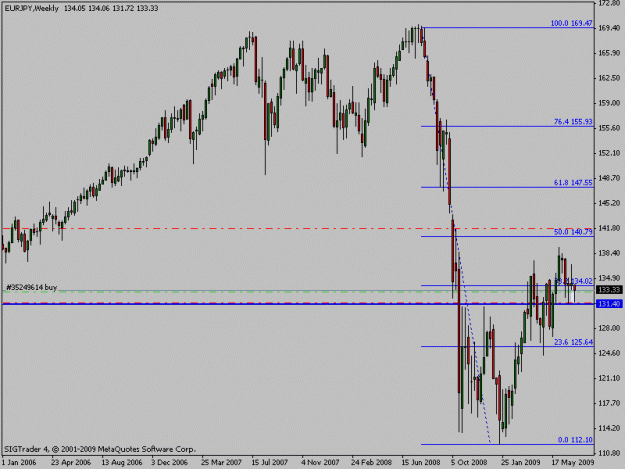
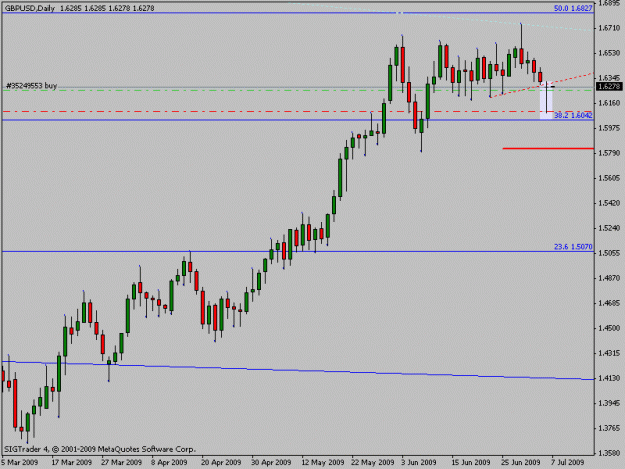
For GU we see a daily doji above this monthly fibo level, there is indicison, to go lower.
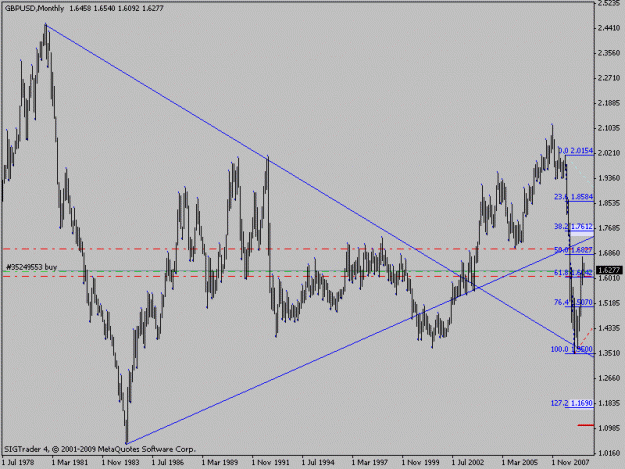
At last I`am bullish over all in the next weeks. Maybe we bounce between those 2 fibo levels, but lets have shy a look at my longterm chart. Please notice direction I draw fibo levels:
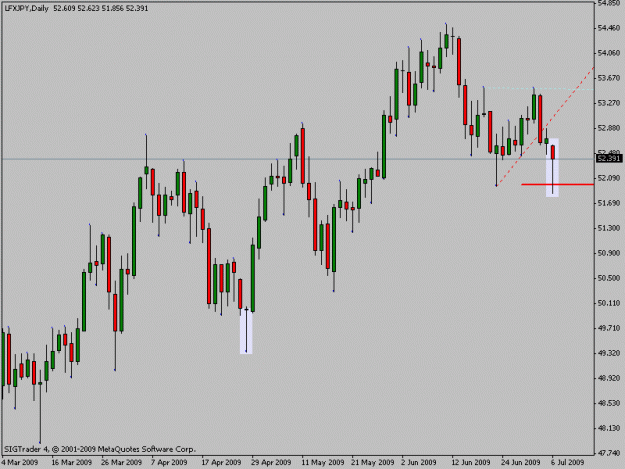
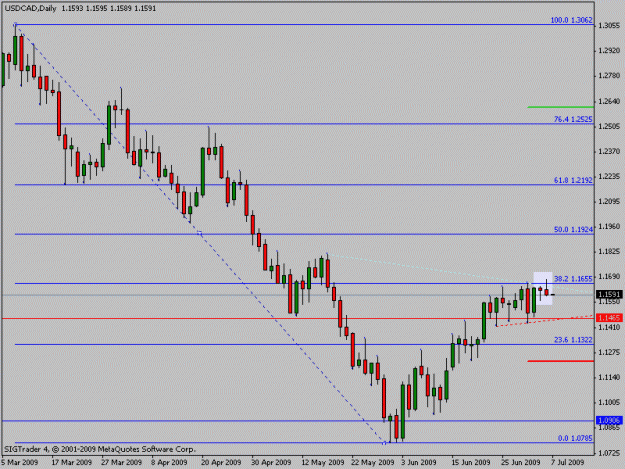
We see candlestick pattern today, which should last minimum for one trading day:
gbp/lfx plus lfx/jpy = geppy is bullish, we see hammer.
If I look correct, geppy has had an downside gap at weekly open,
so in case we have tommorrow a bullish engulfing candle we might see
a morning star. But should be watched tommorrow close, its speculation by now.
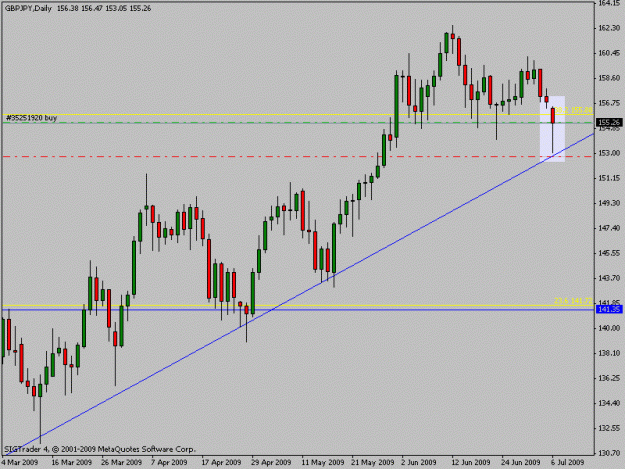
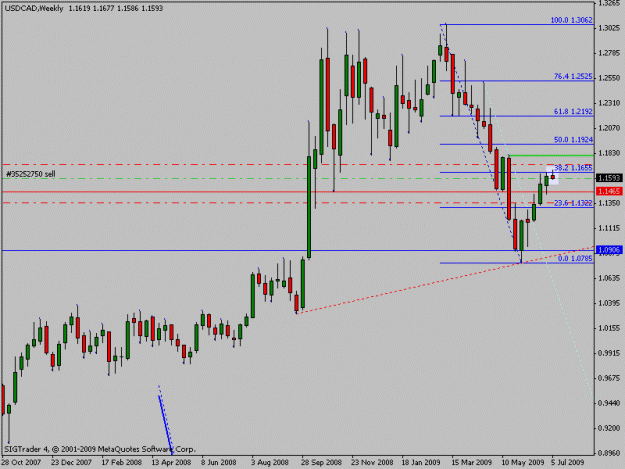