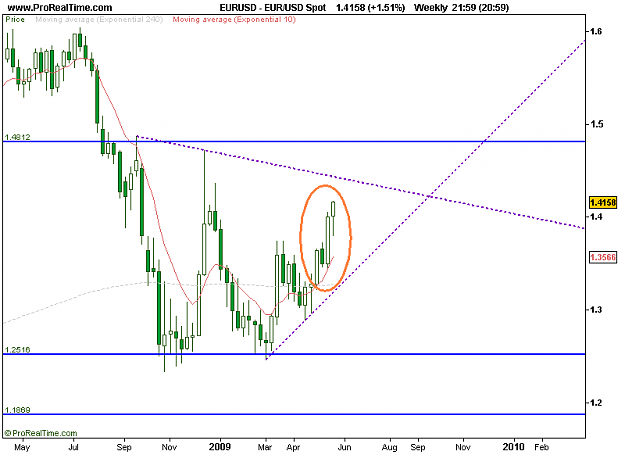
we are in the end of May
therefore look to monthly candle chart
in the first time DX
the long black candlestick signals strong selling pressure in the market
the sellers were aggressive
for LFX JPY
white candles show us 54.220 in the next time
this white candles show the evidence for buying pressure and also enter new buyers in the next time
for LFX JPY
white candles show us 54.220 in the next time
this white candles show the evidence for buying pressure and also enter new buyers in the next time
hi baz
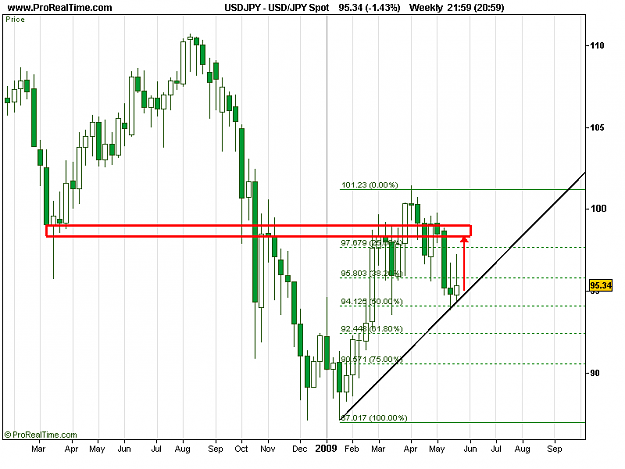
yes we have seen 97.24 that have given us a form bullish morning star pattern in On Thrsday
but then we see a fall on Friday
Ignored
note: if when you see a bullish morning star or doji star pattern in the middel week and then a pullback (change to a long upper wick with small real body= inverted hammer) this change is very good for bull camp no bear camp . because long upper wick show buyers' pressure .
even we can see a red spining top B4 bullish invertd hammer that show us decrease power sellers
now , this is important for us that whether a morning star pattern is good for bull camp or a red spinning top + a bullish invertd hammer in this time ?
Ignored
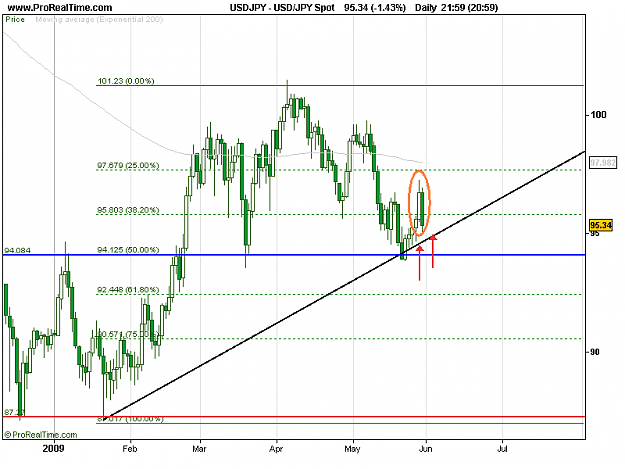
the probability of its existence is small for see abortion bullish inverted hammer in the next week