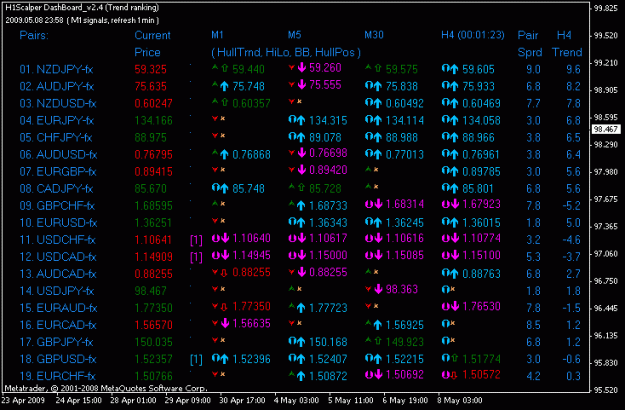
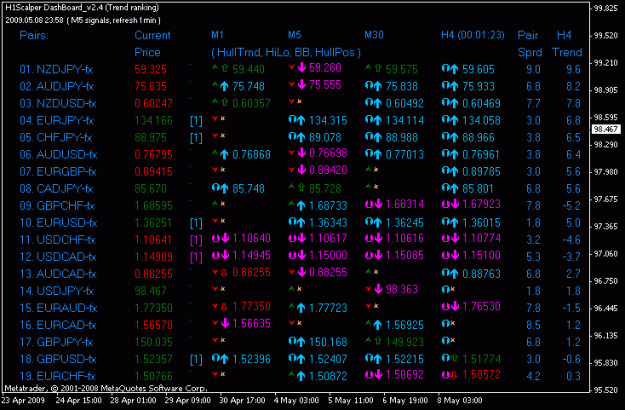
To better see for which timeframe comes the signals, I write in the second upper left row the signal time frame:
( M1 signals, refresh 1 min ) - chart1 or ( M5 signals, refresh 1 min ) - chart2
.
Can you show me an example of a buy and sell level you're seeing rigth now? It's not on the dashboard, but on the individual pair chart, is that right?
Ignored
Swingman has explained, If you are still finding difficulty, I suggest to wait for market to open. Send your chart and see the solution from there.
Yes, I'll have to wait until market opens. I know what the signals are, but his post said the levels are printed on the chart -- and that's what I do not see.
The daily trend column will help with trend strength. You are in the right place. Version 2.4 has more brilliant features programmed. Watch this space for the explanations. Coming soon!
Hi Swingman,Thank you for all the work and time you have put into this system. Iam trying to understand how to know which pair is best to trade as in your ranking. I see some - signs to the left of the trend ranking do they mean abnything ? Also it seems the pairs are ranked most likely trades, ranked best to trade from pair being most likely to be a winner on top and in decending order. Is that right ? Thanks (I did see in one of the pdf files the minus means nothing) It is just confusing me . Thanks for your help
Hi Swingman,Thank you for all the work and time you have put into this system. Iam trying to understand how to know which pair is best to trade as in your ranking. I see some - signs to the left of the trend ranking do they mean abnything ? Also it seems the pairs are ranked most likely trades, ranked best to trade from pair being most likely to be a winner on top and in decending order. Is that right ? Thanks (I did see in one of the pdf files the minus means nothing) It is just confusing me . Thanks for your help
Ignored
Have you read me postings? I wrote two times:
" ranking of the absolut values of the trend slope, calculated for the last 4 bars.
1000*(Hull[0] - Hull[4]) / Hull[4] "
- Still another additional reference: one does not have to trade at any time the pair with the highest trend slope.
If the trend turns from short to long, the trend slope values are small.
For example the trend is long (+0.30), and the signal still short (arrow in the last column is red). The signals arrows remain perhaps 1-2 bars short, then we see long signals (green arrrows) and the trend is upward turning with higher values (+1.3, +2.4 ...)
That is the best occasion to made tourn around trades.
Hello Swingman,
This is very big and great job you are doing. I really love the visual displays of information. I will appreciate it if you can include an email signal alert to go along with it.
Have you read me postings? I wrote two times:
" ranking of the absolut values of the trend slope, calculated for the last 4 bars.
1000*(Hull[0] - Hull[4]) / Hull[4] "
- Still another additional reference: one does not have to trade at any time the pair with the highest trend slope.
If the trend turns from short to long, the trend slope values are small.
For example the trend is long (+0.30), and the signal still short (arrow in the last column is red). The signals arrows remain perhaps 1-2 bars...
Hello Swingman,
This is very big and great job you are doing. I really love the visual displays of information. I will appreciate it if you can include an email signal alert to go along with it.
Ignored
Thanks, but am I in the wrong film?
I work many hours to the program, and you do not even have it started and looked at the parameters
.
Hi Swingman,Thank you for all the work and time you have put into this system. Iam trying to understand how to know which pair is best to trade as in your ranking. I see some - signs to the left of the trend ranking do they mean abnything ? Also it seems the pairs are ranked most likely trades, ranked best to trade from pair being most likely to be a winner on top and in decending order. Is that right ? Thanks (I did see in one of the pdf files the minus means nothing) It is just confusing me . Thanks for your help
Ignored
With all due respect, if you re-read the pdf document "Full Explanations" and work through the examples you will have your questions answered.
I have not only explained the DAILY TREND COLUMN and spent extra time with the examples so Swingman will be spared questions like these. Swingman is a very busy person. Despite this he has provided an excellent strategy with dashboard and a detailed explanation document to help the community.
This document Trading Ideas is in addition to the first one called FULL Explanations in Post #30.
In this there is an explanation of three new features added to the dashboard version 2.3 and 2.4. Further there are some scalping trade examples. On the last page is the choice of TF to enter your trade based on a harmonic theory of numbers.
Again, please re-read a few times as there is alot of detailed information.
thanks a lot to Swingman for the perfect trading system
may i wander if it possible to post the source mq4 files to customize some features and integrate into mts?
what is the role for BBands Stop and ArenDI ATR? for trailing stop is used MA so what is the use for BBands Stop, can you write elaborately about ArenDI ATR in taking decision for traing in and out, please, should it not so important then i'd remove it from the graph to save some window space... any ideas?
could you add some additional params to flexibly customize the Dashboard
1) To make closer two first collumns, to set the distance
2) to make all the columns closer and thus the Dashboard to be more compact by adding a param to do not display BBands Stop value
- Abot the role of BBand Lines and explanations about ArenDi_ATR, please take 10 minutes from your time, and read the first page from the explanation file (last version on last post #76 of lRathi).
- Surely you can remove the ATR, because this is only for me a visual help for decisions when we have big bars (reversal or pin bar).
- At the time I don't post .mq4 files. The system is unfinished.
- I will try in the next version to make closer the columns, you are right.
Maybe is better to give the width in the input parameters. OK.
- I did not understand what is with BBand values? The figures in the DashBoard are possible entrys, I wrote about.
If you will to not see this figures, is possible to give this as input parameter.
could you add some additional params to flexibly customize the Dashboard
1) To make closer two first collumns, to set the distance
2) to make all the columns closer and thus the Dashboard to be more compact by adding a param to do not display BBands Stop value
Ignored
With all due respect, you seem to be trying to cosmetically pay more attention to the shell rather than the pearl inside.
You have not even tried this brilliant system ( the pearl) and dashboard yet! Use it for what it is designed for first, Financial freedom Made easy.
I have never met such a talented gentleman who gives away his talent to help the community FREE .