• Home
  • Forums
  • Trades
  • News
  • Calendar
  • Market
  • Brokers
  • Login
  • Join
  • User/Email: Password:
  • 12:43am
Menu
  • Forums
  • Trades
  • News
  • Calendar
  • Market
  • Brokers
  • Login
  • Join
  • 12:43am
Sister Sites
  • Metals Mine
  • Energy EXCH
  • Crypto Craft

Options

Bookmark Thread

First Page First Unread Last Page Last Post

Print Thread

Similar Threads

Spud's Predictive MTF Stochastics 1,695 replies

LFB System - London Fib Breakout 45 replies

Fib 4Hour MTF Moving Average 287 replies

Journal related to: Spud's MTF Stochastics 178 replies

Spud's PVX Method 25 replies

  • Trading Systems
  • /
  • Reply to Thread
  • Subscribe
  • 166
Attachments: Spud's MTF FIB Breakout System
Exit Attachments
Tags: Spud's MTF FIB Breakout System
Cancel

Spud's MTF FIB Breakout System

  • Last Post
  •  
  • Page 1 23456 19
  • Page 1 234 19
  •  
  • Post #1
  • Quote
  • First Post: May 17, 2007 9:30am May 17, 2007 9:30am
  •  Spudfyre
  • Joined Jan 2007 | Status: MTF Stochastics and Volume/Price | 1,133 Posts
Spud's MTF FIB Breakout System
--------------------------------
Ever since I learned about Fibonacci numbers they have interested my pure mathematical statistical side into a compulsiveness. Having said that, it seems for such a simple sequence of numbers they can lead to very complicated methods of trading.

Here's a simple day trade system with stochastics and Fibonacci numbers that may give you a winning edge in your trades.

Indicators:

Stochastics 5,3,3 and 14,3,3 (high/low, simple) ....use only %K line and overlay in one indicator window.

Fibonacci set levels to:
0 label as 100
.764 label as 23.6
.681 label as 38.2
.500 label as 50.0
.382 label as 61,8
.236 label as 76.4
1 label as 0
Always draw the Fib line from the previous days low to high.

Set-up
At the close of the trading day (call this the previous day since this day is now over) draw you Fib line from the previous day's low to the high and draw it so the level lines extend into today (i.e. set your chart up with a shift)

Entry
Look for the price to break the 100 or 0 level of the Fib. You can do this by watching or setting a long order a little above the 100 level or a short order a little below the 0 level. You want the price to pass the 100/0 level not just touch it.

Meanwhile.....take a look at the stochastics....when/prior to/or just after the price breaks the 100 Fib line you can almost be certain the stoch is breaking the 80 line or higher....well we want it to be or we will wait for it to do it and then we enter the trade. Similarily if the price breaks the 0 line we want the stochastic in the 20 or below area.

You can take a few more risks. In a long; if the stochastics are climbing together after a down move and a turn up; or if the stochastics have crossed 20 and are moving up.


Exit
When the price breaks 100 (long as an example), move your FIB line up so that the 0 line is where the 100 line was. Exit when you hit 23.6 (123.6), 38.2 (138.2) and/or so on.
Let the stochastics be your guide....if they both or one stays above 80 keep riding the trade.
The 14,3,3 stochastic has more bearing on the trade than the 5,3,3, however both together is perfect harmony.

What's MTF and Where is It?

MTF = multiple time frame and it is in the 5,3,3 and 14,3,3 stochastic.

Time Frame
I use the 1H chart for daily. You can use the 4H chart but then you are trading weekly then. I would not use a smaller time frame than 1H as you start to lose the reliability of the Fib.

Currencies
This is universal, but I love the GBPJPY. You want pairs that have some good daily range as you want wide Fib numbers so you can make some pips!
If you are trading the smaller day range pairs, use the 4H/weekly fib.

Umm..Isn't This Just A Breakout Above Yesterday's Hi/Lo?

Well it is if you just trade the breakout and use the stochs....but ohhhh laddie there is sooo much more to this simple system......
The Fib levels give you exit targets, use the Fib/stochs and get used to it....you won't be sorry and you'll understand what comes next (in a little while) a whole lot better.


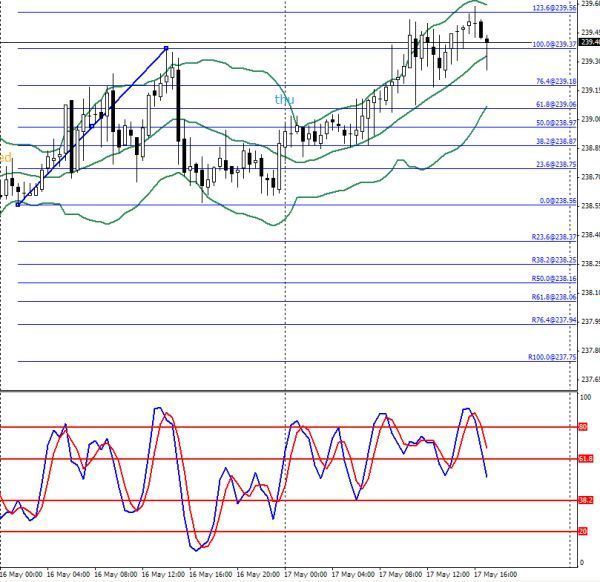
Here's a picture...hopefully it speaks a 1,000 words:
Attached Image
  • Post #2
  • Quote
  • May 17, 2007 9:50am May 17, 2007 9:50am
  •  sepak.orang
  • | Joined Mar 2007 | Status: Member | 157 Posts
hi spud, thanks for your latest method.

one question here, why must we draw fib from low to high? your chart example showing the gj is moving up. so we draw the fib from low to high. when it's moving down so we draw the fib from high to low? am i right abt this spud?

im sorry if this is a silly question. im still learning. especially the fib thingy.


  • Post #3
  • Quote
  • May 17, 2007 9:55am May 17, 2007 9:55am
  •  Spudfyre
  • Joined Jan 2007 | Status: MTF Stochastics and Volume/Price | 1,133 Posts
Quoting sepak.orang
Disliked
hi spud, thanks for your latest method.

one question here, why must we draw fib from low to high? your chart example showing the gj is moving up. so we draw the fib from low to high. when it's moving down so we draw the fib from high to low? am i right abt this spud?

im sorry if this is a silly question. im still learning. especially the fib thingy.

Ignored
I only draw from low to high to make the level labels make sense...i.e. they will always be 0 at bottom and 100 at top. Not too important now, but there is reason to my madness.
 
 
  • Post #4
  • Quote
  • May 17, 2007 10:00am May 17, 2007 10:00am
  •  sepak.orang
  • | Joined Mar 2007 | Status: Member | 157 Posts
Quoting Spudfyre
Disliked
I only draw from low to high to make the level labels make sense...i.e. they will always be 0 at bottom and 100 at top. Not too important now, but there is reason to my madness.
Ignored
okay spud. thank you very much.


  • Post #5
  • Quote
  • Edited May 18, 2007 10:05am May 17, 2007 10:17am | Edited May 18, 2007 10:05am
  •  Spudfyre
  • Joined Jan 2007 | Status: MTF Stochastics and Volume/Price | 1,133 Posts
Here's another long example...notice the stochastic exit indication.

Also I've added a few Fib levels to make life easier. The Fib levels are now:
-1 label as 200
-.764 label as 176.4
-.681 label as 168.1
-.500 label as 150.0
-.382 label as 138.2
-.236 label as 123.6
0 label as 100
.236 label as 76.4
.382 label as 61.8
.5 label as 50.0
.681 label as 38.2
.764 label as 76.4
1 label as 0
1.236 label as -23.6
1.382 label as -38.2
1.500 label as -50.0
1.618 label as -61.8
1.764 label as -76.4
2 label as -100
Attached Image
 
 
  • Post #6
  • Quote
  • May 17, 2007 10:34am May 17, 2007 10:34am
  •  Spudfyre
  • Joined Jan 2007 | Status: MTF Stochastics and Volume/Price | 1,133 Posts
The following 3 charts on next 3 posts are for 3 consecutive days...show how you can follow a continuous down trend...like could this be any easier!

Notice on this chart there is a fake break above 100...see the stochastic...stochastics never lie (well most of the time).
Attached Image
 
 
  • Post #7
  • Quote
  • May 17, 2007 10:34am May 17, 2007 10:34am
  •  Spudfyre
  • Joined Jan 2007 | Status: MTF Stochastics and Volume/Price | 1,133 Posts
Day 2
Attached Image
 
 
  • Post #8
  • Quote
  • May 17, 2007 10:35am May 17, 2007 10:35am
  •  Spudfyre
  • Joined Jan 2007 | Status: MTF Stochastics and Volume/Price | 1,133 Posts
Day 3
Attached Image
 
 
  • Post #9
  • Quote
  • May 17, 2007 10:43am May 17, 2007 10:43am
  •  Spudfyre
  • Joined Jan 2007 | Status: MTF Stochastics and Volume/Price | 1,133 Posts
Again the stochastics don't lie.

We get a good entry but the market goes against us in this chart. We get plenty of warning from the stochastics and depending on how long you waited your losses would be fairly small if any...you may have even gained a few pips.
Attached Image
 
 
  • Post #10
  • Quote
  • May 17, 2007 10:54am May 17, 2007 10:54am
  •  Spudfyre
  • Joined Jan 2007 | Status: MTF Stochastics and Volume/Price | 1,133 Posts
Here's today so far....

We had a good long entry signal but that signal is fading as the stochastic begins to droop below 80. I grabbed 5 pips and decided to get out and wait to see what develops.
Attached Image
 
 
  • Post #11
  • Quote
  • May 17, 2007 10:56am May 17, 2007 10:56am
  •  KudzuFX
  • | Joined Jul 2006 | Status: Member | 547 Posts
Spud,

Good stuff from your brain as always. Just curious if this method you delineate here is intended to supercede the earlier MTF Stoch or is this another way to look at Stochs?

Thanks,
KudzuFX
 
 
  • Post #12
  • Quote
  • May 17, 2007 11:09am May 17, 2007 11:09am
  •  Spudfyre
  • Joined Jan 2007 | Status: MTF Stochastics and Volume/Price | 1,133 Posts
Quoting KudzuFX
Disliked
Spud,

Good stuff from your brain as always. Just curious if this method you delineate here is intended to supercede the earlier MTF Stoch or is this another way to look at Stochs?

Thanks,
KudzuFX
Ignored
This is yet another way to make simple winning trades in Forex.
 
 
  • Post #13
  • Quote
  • May 17, 2007 11:35am May 17, 2007 11:35am
  •  Rialto
  • | Additional Username | Joined Dec 2005 | 278 Posts
Thanks Spud. This looks like another successful method of yours - and your chart is so, so easy to look at, as well as to read. I wonder if you realize just what an encouraging and positive effect your knowledge and generosity are having on so many people. It makes new traders, such as myself, much more confident - especially when seeing profitable trades. Thanks again.
 
 
  • Post #14
  • Quote
  • May 17, 2007 11:46am May 17, 2007 11:46am
  •  banzai
  • Joined Jun 2006 | Status: Member | 467 Posts
Anyway you upload your template? Thanks.
 
 
  • Post #15
  • Quote
  • May 17, 2007 11:47am May 17, 2007 11:47am
  •  Westie
  • | Joined Oct 2006 | Status: Member | 150 Posts
hey spud good stuff, couple questions,

1. You said 1hr is like daily timframe, I thought the 1hr with 14,3,3 is like
a 4hr chart, I'm just confused by this.

2. How many pips do you consider enough for the break of the hi or low.

Thanks
 
 
  • Post #16
  • Quote
  • May 17, 2007 11:57am May 17, 2007 11:57am
  •  Spudfyre
  • Joined Jan 2007 | Status: MTF Stochastics and Volume/Price | 1,133 Posts
Quoting Westie
Disliked
hey spud good stuff, couple questions,

1. You said 1hr is like daily timframe, I thought the 1hr with 14,3,3 is like
a 4hr chart, I'm just confused by this.

2. How many pips do you consider enough for the break of the hi or low.

Thanks
Ignored
The 1Hr is for "day trading" and you are using the "previous day" hi/lo for the Fib.

The 4Hr uses the previous week hi/lo for the fib and you'd be trading on the week.

The 14,3,3 is "like a" longer" time frame compared to the 5,3,3 stochastic. On the 1H it is like a 1H 5,3,3 and 3H 5,3,3...."like" is a big word here because it is not exactly like using a 3H chart and a 1H chart with 5,3,3 stochastics.

How many pips for a break? Well I just eyeball it and look at he space between 100 and 123.6 and look for price to go past about 5-10% of that distance. Obviously you don't want to wait too long in case we need to bail out or take profit at 123.6. Getting in too early isn't really an issue, as long as you wait for at least a 1 pip past the 100 level entry. Too early may mean riding it a bit longer. Let the stochastics be your guide too.
 
 
  • Post #17
  • Quote
  • May 17, 2007 4:11pm May 17, 2007 4:11pm
  •  PiPr Pro
  • | Joined Nov 2006 | Status: Member | 312 Posts
this is a slight derivation on the way I trade. I will try to post some charts as we go along and add some additional notes on fib targets. Also right click the fib line and chose Fibo Properties, then chose the Fib Levels tab then add @%$ to the description line in MT4 (example [email protected]%$. This will place the price next to the fib level.
Attached Image
 
 
  • Post #18
  • Quote
  • May 17, 2007 4:16pm May 17, 2007 4:16pm
  •  jcarrier
  • | Joined Feb 2007 | Status: Member | 34 Posts
I bet between the 2 of you we can make this the best system out there. I look forward to following this thread and seeing more charts...Joe
 
 
  • Post #19
  • Quote
  • May 17, 2007 4:52pm May 17, 2007 4:52pm
  •  Micro-MiniMe
  • | Joined May 2007 | Status: Seasoned Trader | 820 Posts
This is sooo simple, even a dork like me can trade it! Thank you Thank you Thank you. I can see so many possible variations for stop losses, money managment ect. I'll be eagerly watching this thread
 
 
  • Post #20
  • Quote
  • May 17, 2007 5:07pm May 17, 2007 5:07pm
  •  Spudfyre
  • Joined Jan 2007 | Status: MTF Stochastics and Volume/Price | 1,133 Posts
Quoting PiPr Pro
Disliked
this is a slight derivation on the way I trade. I will try to post some charts as we go along and add some additional notes on fib targets. Also right click the fib line and chose Fibo Properties, then chose the Fib Levels tab then add @%$ to the description line in MT4 (example [email protected]%$. This will place the price next to the fib level.
Ignored
Thanks for the @%$ tip. I'd be interested in knowing more about your sytem.
 
 
  • Trading Systems
  • /
  • Spud's MTF FIB Breakout System
  • Reply to Thread
    • Page 1 23456 19
    • Page 1 234 19
0 traders viewing now
  • More
Top of Page
  • Facebook
  • Twitter
About FF
  • Mission
  • Products
  • User Guide
  • Media Kit
  • Blog
  • Contact
FF Products
  • Forums
  • Trades
  • Calendar
  • News
  • Market
  • Brokers
  • Trade Explorer
FF Website
  • Homepage
  • Search
  • Members
  • Report a Bug
Follow FF
  • Facebook
  • Twitter

FF Sister Sites:

  • Metals Mine
  • Energy EXCH
  • Crypto Craft

Forex Factory® is a brand of Fair Economy, Inc.

Terms of Service / ©2023