DislikedOn my screen, I have 6 charts; 2 each of gbp/usd, eur/usd and eur/jpy. Three of them are set up as a pivot point display, and the other three are set up as a psych-line display. The point is that no screen is overloaded with all sorts of lines, so that if I'm in a trade using psych-lines, I can keep an eye on what's happening regarding the pivot point situation, and vice-versa.
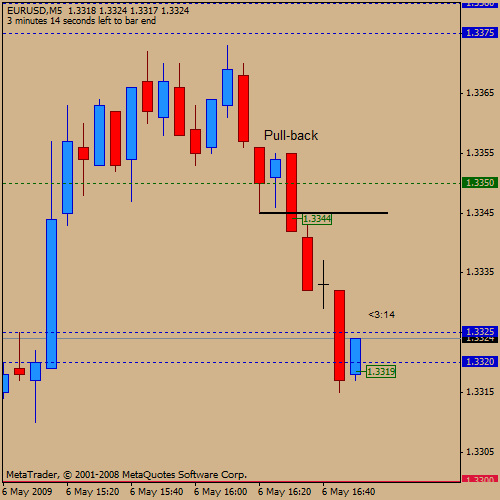
With regard to your question......yes, the doji was situated sort of straddling the psych-zone, but the chart below showed it as forming just above the S2 line. If price...Ignored
When you say "chart with psych-lines", do you mean an indi which draws the lines at xx20 and xx80? Which one is that?
One Chart is Worth Ten Thousand Words.