Guys, sorry for somewhat off-thread comments, but I just wanted to highlight the importance of PA and levels. Their combination is the key to determining the quality of setups.
Ignored
Some great examples there, mate, but the one that really grabs me is the one on the far right. It's a classic OzTrader (YouTube) "fakey" trade. You have a massive pin-bar followed by an "inside" candle. The following candle then slightly edges above the "inside" candle (that's the "fakey"), then price just seems to plummet southwards. I have no idea of the pair or TF, mate, but that OzTrader thing just seems to WORK!!
Joined Nov 2008
|
Status: You must obey the dance commander
|2,038 Posts
Good morning chaps,
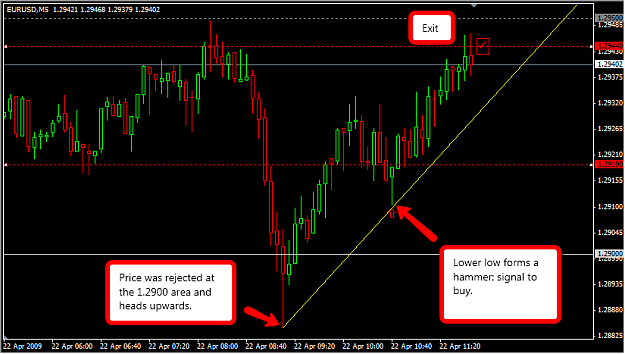
Glad to see everyone is still doing well trading this great method - I haven't had a lot of time to look at the 5 min charts just lately but I did grab this little move earlier...
I thought I would try a slightly different approach after watching a couple of posts from Islander.
Price was unable to stay below 1.2900 and started heading higher. We then made a higher low (as indicated on the chart) which formed a hammer so I decided to buy the break above it.
Joined Sep 2006
|
Status: Son of this Sceptred Isle.
|3,635 Posts
Great trades from Islander and DanUK (welcome back, Dan)!!
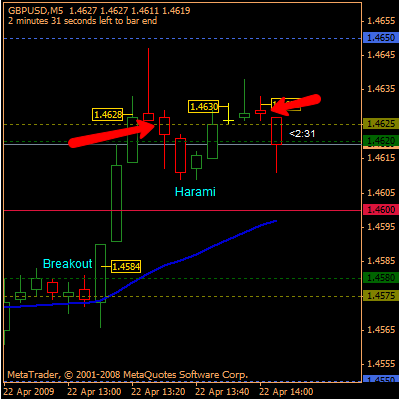
Two trades here from cable....fairly self-explanatory. The first as a result of a breakout, and the second from a harami reversal signal. The first trade was good, but with the second, I was lucky to get out minus just a couple of pips. Usually, a break of a psych-zone, more often than not results in a push up (or down) to the next line of S/R. Not in this case though!!
Great trades from Islander and DanUK (welcome back, Dan)!!
Two trades here from cable....fairly self-explanatory. The first as a result of a breakout, and the second from a harami reversal signal. The first trade was good, but with the second, I was lucky to get out minus just a couple of pips. Usually, a break of a psych-zone, more often than not results in a push up (or down) to the next line of S/R. Not in this case though!!
Ignored
Good BO trade, EV! Did you have Limit order above the range - with price moving quickly (and UK news day) it must be hard to decide "live" that BO happened?
Interesting how diff. traders see diff. things. That Harami escaped me. But I was thinking of trading those two Shooting Stars, entering at the open of a candle that followed each Star, with SL at 50% of Star 1 and above Star 2, with TP at RR1. Passed on it due to the news day.
Joined Nov 2008
|
Status: You must obey the dance commander
|2,038 Posts
Hi guys,
Just managed to grab a nice move on USD/CAD - I was actually just checking it for a longer term move I am watching and noticed a nice little setup - chart attached.
Target was hit and then formed a very nice looking shooting star/pin-bar which almost looks like it would be worth a trade! It's counter-trend though without any other confluence (that I can see) so I won't be in it!
Joined Sep 2006
|
Status: Son of this Sceptred Isle.
|3,635 Posts
Nope, no limit order, mate. Just an entry as price broke the imaginary resistance line. Sometimes they work and sometimes they don't!! This one did, but I see your point.
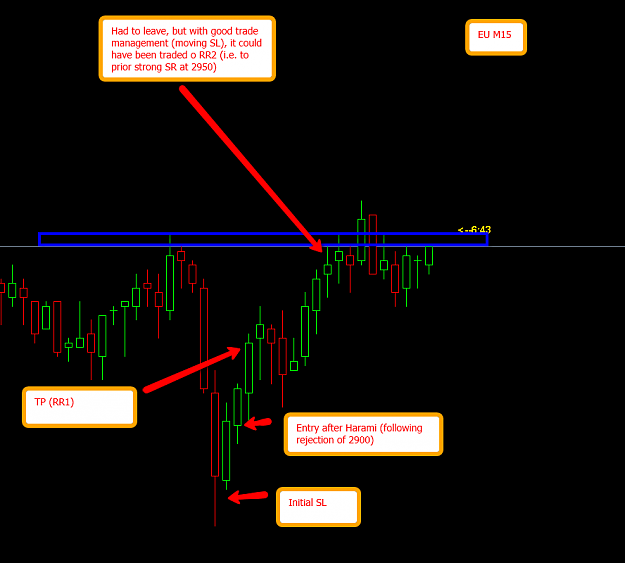
By the way, with regard to your chart, I hope you don't mind me pointing out that your entry wasn't after a harami, mate......it was afte a bullish piercing pattern. Nice trade, though!!
Just managed to grab a nice move on USD/CAD - I was actually just checking it for a longer term move I am watching and noticed a nice little setup - chart attached.
Target was hit and then formed a very nice looking shooting star/pin-bar which almost looks like it would be worth a trade! It's counter-trend though without any other confluence (that I can see) so I won't be in it!
Dan
Ignored
Nice trade, Dan, but what's with the bars? Candles, man, candles!! That's where it's at!!!
Edit: Incidentally, where does one appropriate that fancy labelling you demonstrated on your chart?
Very neat, clear and concise!!
Joined Nov 2008
|
Status: You must obey the dance commander
|2,038 Posts
Just thought I would post this chart as it might be of some educational value! As there has been some talk on here recently of taking account of S/R levels - check out what happened to the pin-bar I mentioned on U/C.
You will see previous bar highs killing the move! Just something to think about!
Glad to see everyone is still doing well trading this great method - I haven't had a lot of time to look at the 5 min charts just lately but I did grab this little move earlier...
I thought I would try a slightly different approach after watching a couple of posts from Islander.
Price was unable to stay below 1.2900 and started heading higher. We then made a higher low (as indicated on the chart) which formed a hammer so I decided to buy the break above it.
Closed out at 1.2944 for a 1:3 trade.
Ignored
Hi Dan - nice trade - I was in it too as I had a note on my hourly chart about the high volume ~graveyard doji that made the low at 2887 on Monday. Todays low on an hourly hammer was also on high volume, so I'll be buying again on pull backs into the 900 area - assuming I get confirmation from the PA on the lower TFs.
Hi Dan - nice trade - I was in it too as I had a note on my hourly chart about the high volume ~graveyard doji that made the low at 2887 on Monday. Todays low on an hourly hammer was also on high volume, so I'll be buying again on pull backs into the 900 area - assuming I get confirmation from the PA on the lower TFs.
Ignored
FYI, Euro's currently trading between two DP mid pivot levels, MS1 at 2919 and MR1 at 2970.
I'm long again after the small spinning top at MS1, trying for MR1, but ready to TP....
With UK's Darling talking up his budget, right now cable's a bit to hairy for me!
FYI, Euro's currently trading between two DP mid pivot levels, MS1 at 2919 and MR1 at 2970.
I'm long again after the small spinning top at MS1, trying for MR1, but ready to TP....
With UK's Darling talking up his budget, right now cable's a bit to hairy for me!
Nope, no limit order, mate. Just an entry as price broke the imaginary resistance line. Sometimes they work and sometimes they don't!! This one did, but I see your point.
By the way, with regard to your chart, I hope you don't mind me pointing out that your entry wasn't after a harami, mate......it was afte a bullish piercing pattern. Nice trade, though!!
Ignored
Oops, I sometimes bring bar-related logic (where wicks do count) to candles. Thank you for pointing that out!
You will see previous bar highs killing the move! Just something to think about!
Ignored
Well spotted, Dan! Trading any setup into a strong SR level nearby is a no-go: not too hard to spot if one remembers about it during the "pre-flight" check.