And the volatility for gold is a real beauty.
2000 pips per day is not an exception.
100 pips per minute happens very often.
Shamu
Ignored
Shamu, I think silver is currently undervalued. You may like to check gold:silver parity over last one year. For gold around 900, it used to be close to 17.50/18. It is around 12.80 now.
Yes, it shows significant moves, but spreads are wide too.
After a week of being down without internet and movers distroying my trading PC I am back at it.
This next week I am going to be looking for failures in the 3500, 3520, and 3560 areas to start shorting this pair. Of course PA will determine if those areas are valid. I am using the pivot points from a week ago and they appear to still be intact. Again, price will tell.
Take care everyone and trade what you see.
Ignored
For last several hours I am trying to convince myself that it will move north next week. But, everytime conclusion comes to what you mentioned above.
After a week of being down without internet and movers distroying my trading PC I am back at it.
This next week I am going to be looking for failures in the 3500, 3520, and 3560 areas to start shorting this pair. Of course PA will determine if those areas are valid. I am using the pivot points from a week ago and they appear to still be intact. Again, price will tell.
Take care everyone and trade what you see.
Ignored
Just being curious, why are you looking for failure as oppose to buying the dips in the context of the prevailing PA ? Are your indicators more effective in spotting failure becos so far I have not come across any indicators that can generate a failure signal other than indicating a topping/stalling/basing signals.
I may be missing something here and will appreciate to learn your rationale supporting those calls.
Thx in advance.
Ignored
I suppose I could say it is my feel good indicator but that would be a lie. I might be using different time frames than you. I look at the daily and weekly and then use tick charts to determine entry exit. The prevailing trend on my charts are flat on the monthly and the weekly is buried on short. With the monthly being flat that could mean it is getting ready to go long. If that happens I would expect somewhere in the 3860 area, but not this week.
The weekly is showing the current trend as a pullback to the prevailing short...so far. Again, pa tells all. There is divergence on the current move up on both daily and weekly that is telling me this last move was more of a knee jerk reaction to the news than anything else.
I could be wrong, so don't trade what I see - trade what you see.
I suppose I could say it is my feel good indicator but that would be a lie. I might be using different time frames than you. I look at the daily and weekly and then use tick charts to determine entry exit. The prevailing trend on my charts are flat on the monthly and the weekly is buried on short. With the monthly being flat that could mean it is getting ready to go long. If that happens I would expect somewhere in the 3860 area, but not this week.
The weekly is showing the current trend as a pullback to the prevailing short...so far. Again, pa...
Ignored
First, I appreciate and thx for your respond.
Second, there was never any mention about me trading what you or anybody for that matter see or said.
Third, I was just curious mabbe you are having a indicator that can effectively tell you of a failure signal at those very specific levels to initiate your trade calls as posted by you.
Last, I am also using daily weekly and monthly chart but for a different reason. Its a definite nono for me to use those m/t charts to trade intraday which you apparently do. I wish you the best.
Thx again for your story and a story then that I will definitely believe.
Last, I am also using daily weekly and monthly chart but for a different reason. Its a definite nono for me to use those m/t charts to trade intraday which you apparently do. I wish you the best.
Thx again for your story and a story then that I will definitely believe.
Ignored
I didn't mean to say that you specifically would trade my setup. It was for everyone on the forum. You know as well as I do people will follow and then it was "YOUR CALL" that put them in a bad place.
I don't have an indicator that tells me price has failed or will fail at a certain spot. I use the same lagging indicators as everyone else with pivot points. I do use MA's with their data points set on RSI which I think gives me a leader to what is going to happen. Other than that and years of chart time, everything is the same as everyone else.
Take care and make lots of points.
Edit: I also have a short that is still running from last month before I relocated and lost my trading pc. Missed my TP by 12 points and I still think it is a valid trade.
Hi Arthur,
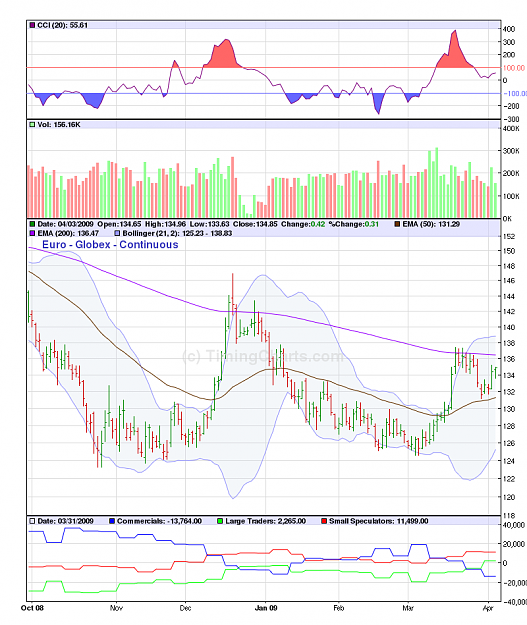
I look at this report every week and try to understand what it is telling me, to no avail.
I wonder if you could help the uninitiated, like me, with your take on how to read these figures, and what we should be looking for.
Thanks in advance.
Hi Arthur,
I look at this report every week and try to understand what it is telling me, to no avail.
I wonder if you could help the uninitiated, like me, with your take on how to read these figures, and what we should be looking for.
Thanks in advance.
the cot measures both institutional and non institutional futures contract open interest as separate. The "idea" is that institutional open interest in a pair is opposite to their spot market or shorter term positions as a hedge, but I am not so sure about that. The non institutional open interest represents other players, and often seems to be in contrast to the institutions. I spent a lot of time a year ago looking at this data, developed my own charts and frankly, found it inconsistent as an indicator. The site i linked to, runs a pretend portfolio (or they used to) that trades based on the COT reports, and I think the historical data showed it could be effective trading signal, but as all systems do, it was not a guarantee. You know things change and currency moves for so many reasons these days, I don't think anything is so cut-and-dry, any longer.
It's interesting to look at, but I think I would cautious about thinking too long on EURO based on COT. All we need is an indication that EURO will start buying their bonds as US FED has, and quantitative easing gets a hold of EURO valuation.
the cot measures both institutional and non institutional futures contract open interest as separate. The "idea" is that institutional open interest in a pair is opposite to their spot market or shorter term positions as a hedge, but I am not so sure about that. The non institutional open interest represents other players, and often seems to be in contrast to the institutions. I spent a lot of time a year ago looking at this data, developed my own charts and frankly, found it inconsistent as an indicator. The site i linked to, runs a pretend portfolio...
Ignored
Hi TIckerShuffl,
Would you know a source of weekend currency quotes?
Would you know a source of weekend currency quotes?
Ignored
the only one I know of that might be reasonably reliable... but i pay no attention to weekend numbers so can't actually say.
they do show the time of the last update and that could be handy. you can sort the times by clicking on the column header and get the most recent update times to see what moved last...