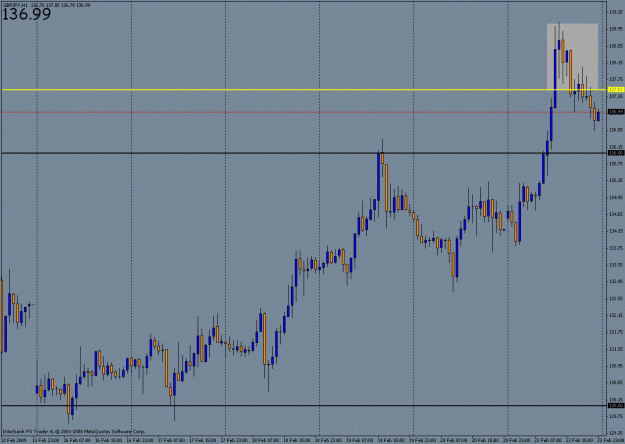
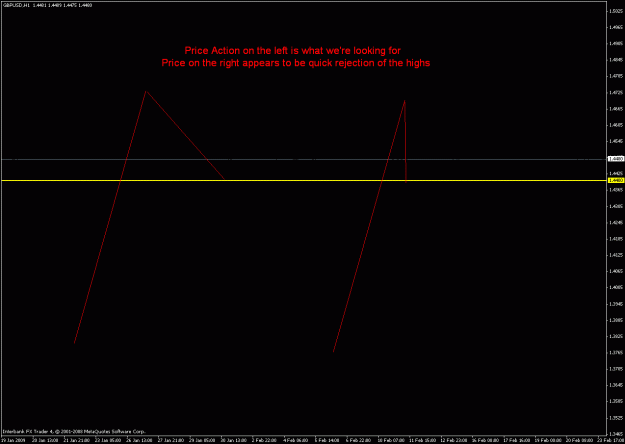
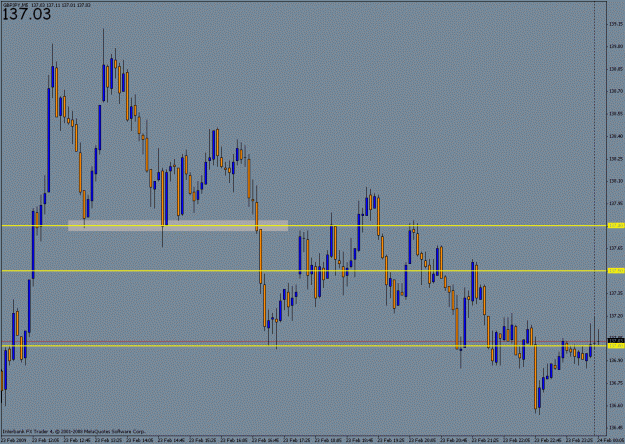
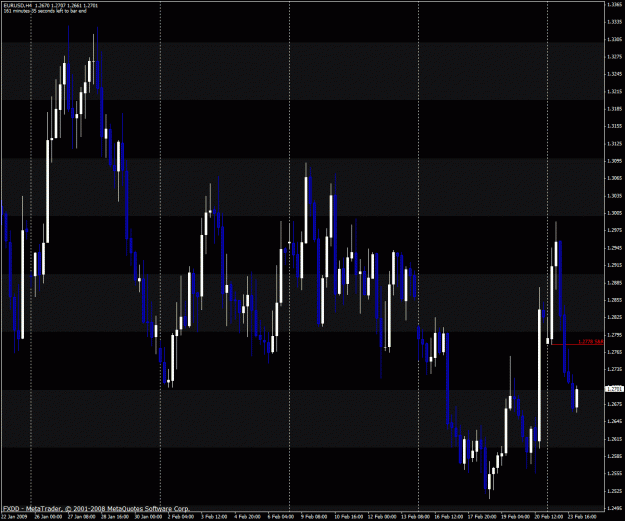
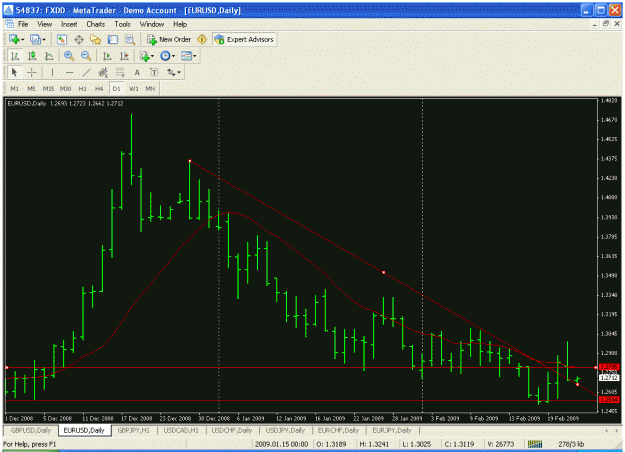
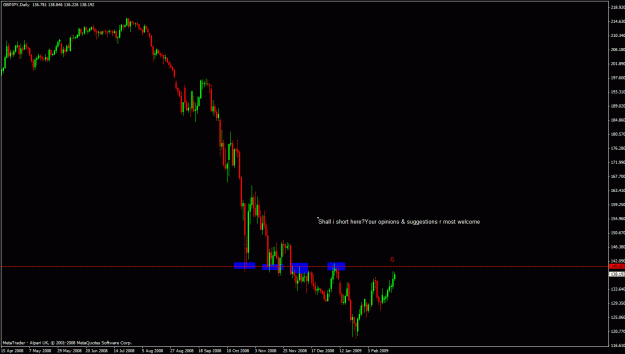
Ok, I have time to look at the other one. GBPJPY long at 137.50. Again, look at the 1 hour. Even the 4 hour. There's no space here. Price shot up past it, but then came back right away to your level. It appeared to be a quick rejection of the highs, not a slow steady sell off to the level we're looking at. In my 2nd chart, GBP/JPY's price action resembled the right side example. We're looking for PA to resemble the left side. Also as with the EUR/USD, look how price stopped right above the level before continuing down. Again, it found support, just not at our desired level. I hope this makes sense
Attached Image(s) (click to enlarge)