• Home
  • Forums
  • Trades
  • News
  • Calendar
  • Market
  • Brokers
  • Login
  • Join
  • User/Email: Password:
  • 8:50pm
Menu
  • Forums
  • Trades
  • News
  • Calendar
  • Market
  • Brokers
  • Login
  • Join
  • 8:50pm
Sister Sites
  • Metals Mine
  • Energy EXCH
  • Crypto Craft

Options

Bookmark Thread

First Page First Unread Last Page Last Post

Print Thread

Similar Threads

What platform has tick by tick (multiple chart filling) data replay? 4 replies

Tick Size, Tick Rate, Tick Spread, and Tick Logger indicators 36 replies

Indicator Tick Chart Vs. Broker Tick Chart 0 replies

Tick by Tick trading? 5 replies

To Tick or not to Tick? (any strategy here?) 7 replies

  • Trading Systems
  • /
  • Reply to Thread
  • Subscribe
  • 23
Attachments: GBPUSD 10-tick chart strategy/idea (in progress)
Exit Attachments

GBPUSD 10-tick chart strategy/idea (in progress)

  • Last Post
  •  
  • 1 Page 2 3
  • 1 Page 2 3
  •  
  • Post #21
  • Quote
  • Mar 23, 2007 12:35pm Mar 23, 2007 12:35pm
  •  jimbil
  • | Joined Feb 2007 | Status: Member | 201 Posts
Quoting beas5112
Disliked
Being aware of the psych levels of 00, 25, 50, and 75 is always encouraged. The typical school of thought is to fade these levels. Having said that, I have some friends that know this is "typical", and trade contrarian to the fade. At any rate, we should be aware of these levels.

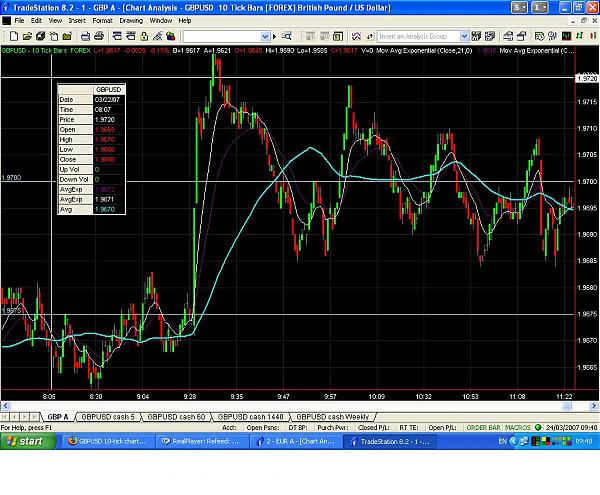
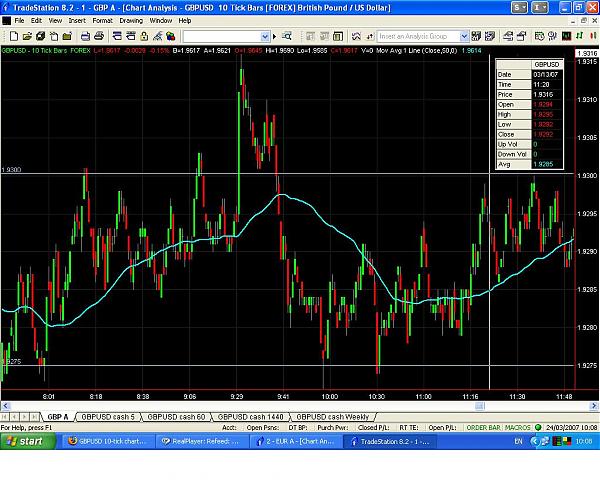
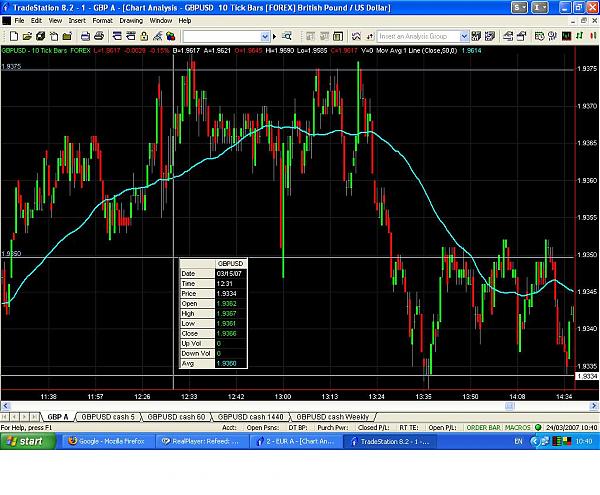
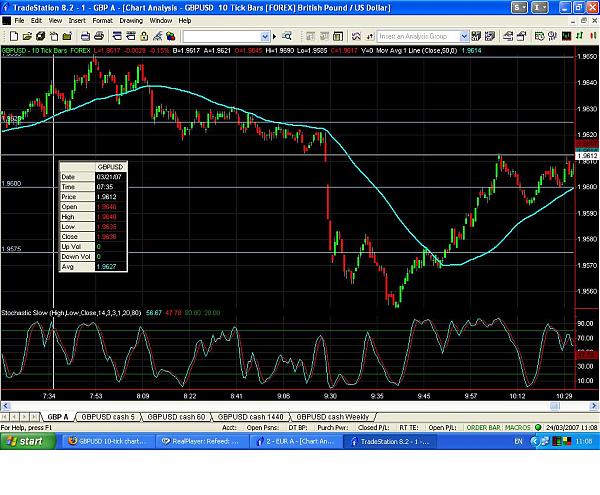
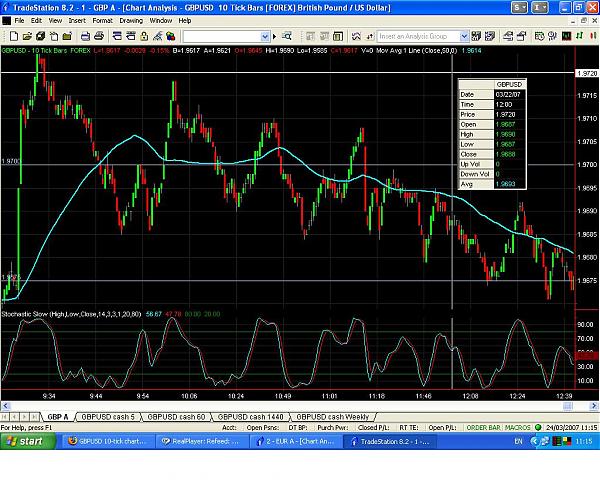
I like plotting a ma on select time frames and looking for s/r and trend at these levels. A 50sma is a good one to consider, you might consider looking at higher time frame 50's, and plotting them on your smaller time frames (ex - 50sma on 100tick = 500sma on 10tick). Just have to play with the ma and find one or two that gives the cleanest look most of the time. I like to plot 60min values of ma's, bands, etc. on lower level time frames.

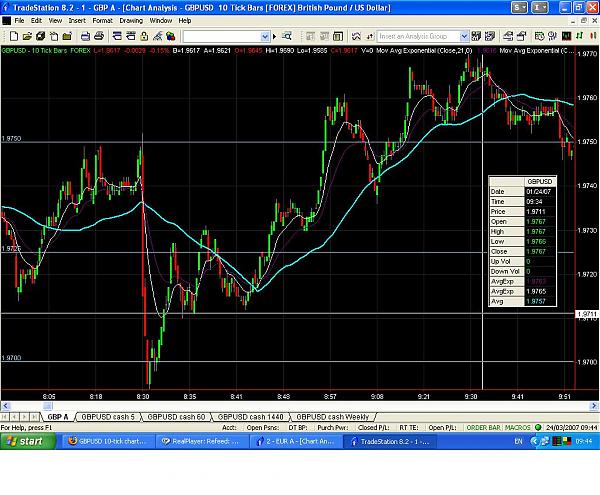
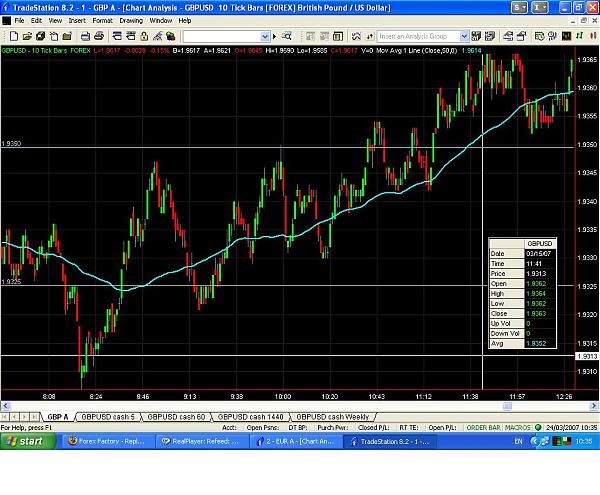
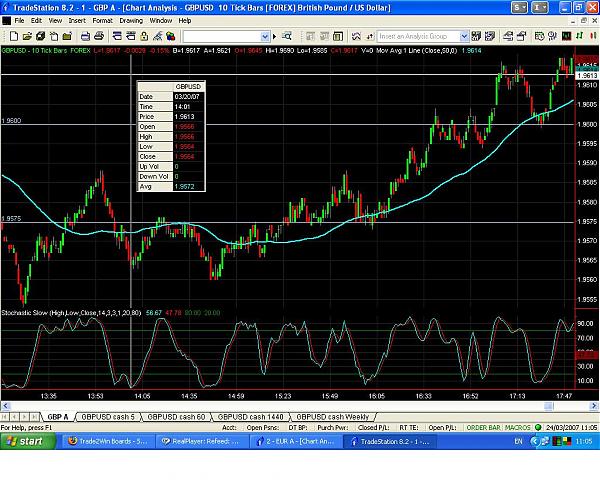
It looks like you are wanting to trade breakouts on key levels at a very small time frame. At times, it will look great, and on some days you will get whipped to death. Filtering when these times are is the rub, and not easily defined. You might consider looking at this at high volatility times during news, having a clear risk to reward defined, which is the key for any methodology. Good luck and good trading.
Ignored
Hi thanks.

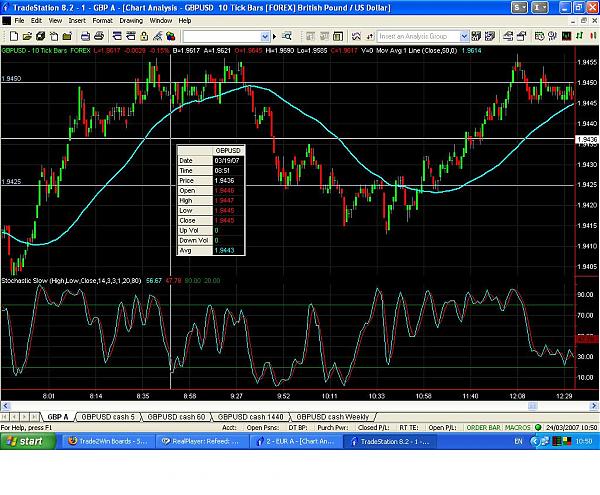
Yes using 50SMA to determine entry (hopefully with enhanced insight through 00255075 & HH, HL, LL, LH helping to make entries better than a 50/50 guess) - will quickly tell us if we are trading in the right direction.
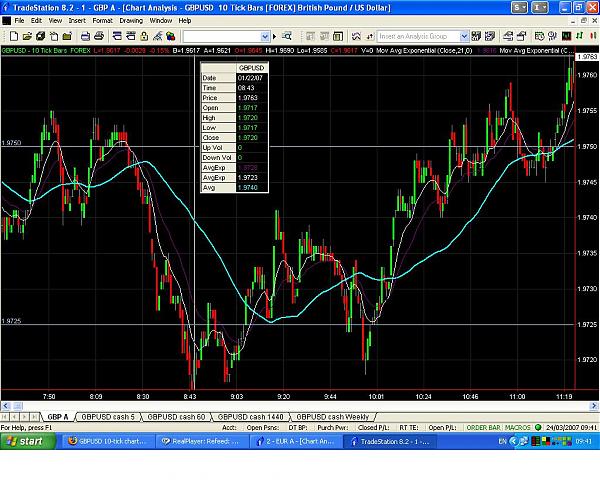
We will sometimes find that we chose to trade in the in the wrong direction, but this should soon become evident.

Using 50SMA as an entry, we could expect to be trading in the right direction 50% of the time. However, our SL could be hit before we see any available profit, only for the trade to then go into profit in our original direction.

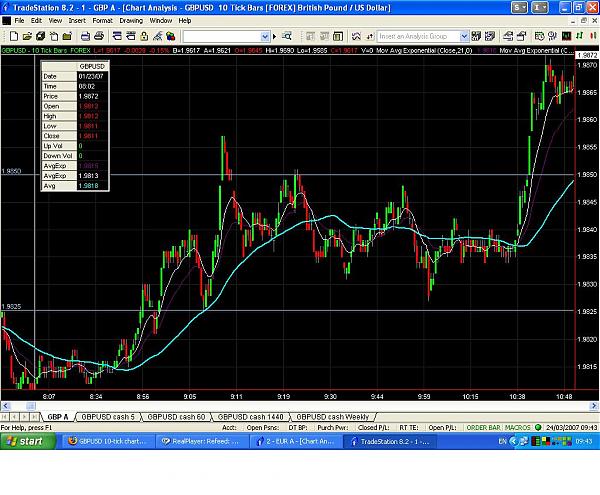
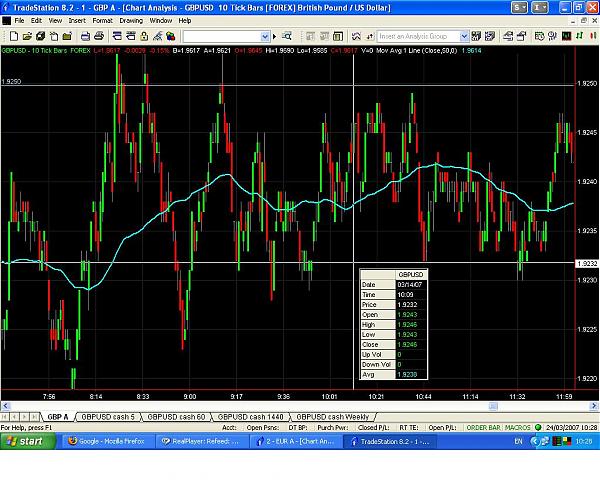
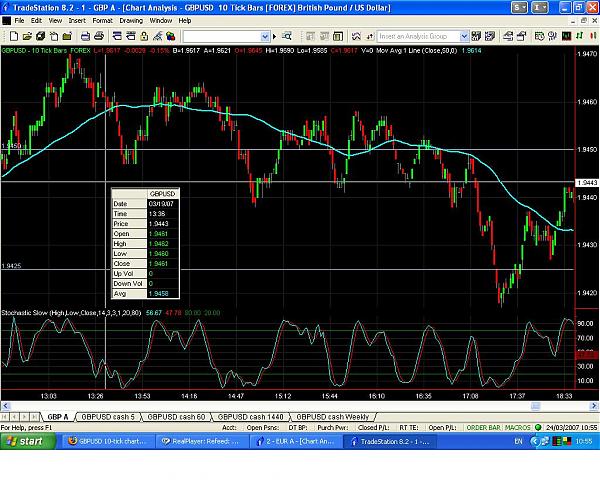
Being able to identify a range/consolidation pattern is important, to avoid whipsaws, and thats where HH, HL, LL, LH can be useful so that we can see what needs to happen before a breakout can occur/beofre a trend can form.
 
 
  • Post #22
  • Quote
  • Edited at 5:59am Mar 24, 2007 5:12am | Edited at 5:59am
  •  jimbil
  • | Joined Feb 2007 | Status: Member | 201 Posts
Hi

From the 550+ views of this thread, and only a handful of responses, and no suggestions as to how GBPUSD could be traded profitably with these chart settings, does this mean that none of the people who have viewed this thread, believe that they could trade GBPUSD profitably with these chart settings?

If so, why not?

And what does this say about our skills as traders?

Many thanks.

PS. Please don't think I'm being sarcastic or obnoxious in any way. I just find it surprising that with such a simple chart set-up, & so many successful & experienced traders lurking in these FF forums, no-one (myself included) has been able to offer any suggestions as to how GBPUSD could be traded profitably - when such obvious profits seem to be available on the screen shots that i have posted.
 
 
  • Post #23
  • Quote
  • Edited at 6:06am Mar 24, 2007 5:46am | Edited at 6:06am
  •  jimbil
  • | Joined Feb 2007 | Status: Member | 201 Posts
...........On the following screenshots, I've also included a 10 & 21MA (but in my thinking these are non important). The 50SMA is the sky blue MA.
Attached Image
 
 
  • Post #24
  • Quote
  • Mar 24, 2007 5:47am Mar 24, 2007 5:47am
  •  jimbil
  • | Joined Feb 2007 | Status: Member | 201 Posts
..................
Attached Image
 
 
  • Post #25
  • Quote
  • Mar 24, 2007 5:47am Mar 24, 2007 5:47am
  •  jimbil
  • | Joined Feb 2007 | Status: Member | 201 Posts
......................
Attached Image
 
 
  • Post #26
  • Quote
  • Mar 24, 2007 5:49am Mar 24, 2007 5:49am
  •  jimbil
  • | Joined Feb 2007 | Status: Member | 201 Posts
Do any of these screenshots stimulate any ideas as to how we can lock in profits?
Attached Image
 
 
  • Post #27
  • Quote
  • Mar 24, 2007 6:10am Mar 24, 2007 6:10am
  •  jimbil
  • | Joined Feb 2007 | Status: Member | 201 Posts
This chart is perhaps the whippiest yet. Very messy.
Attached Image
 
 
  • Post #28
  • Quote
  • Mar 24, 2007 6:29am Mar 24, 2007 6:29am
  •  jimbil
  • | Joined Feb 2007 | Status: Member | 201 Posts
Another messy whippy period of market price action for GBPUSD.
Attached Image
 
 
  • Post #29
  • Quote
  • Mar 24, 2007 6:36am Mar 24, 2007 6:36am
  •  jimbil
  • | Joined Feb 2007 | Status: Member | 201 Posts
A fairly whippy/messy gradual up trend.
Attached Image
 
 
  • Post #30
  • Quote
  • Mar 24, 2007 6:38am Mar 24, 2007 6:38am
  •  boxingislife
  • Joined Jan 2006 | Status: gamblin wit style | 740 Posts
jimbil
keep the 50 sma and the 10 ticks chart
drop everything else
add a 14,3,3 stochastics and when price is above 50 sma and retraces enter when the stochastics cross up. as long as price retraces and doesnt break the 50 sma then take the trade. exit when stochastic gets to the extreme or reversal bars appear. and vice versa

look at the picture
price is under the 50
it retraced a bit and didnt go very far
the stochastic reached an extreme and started turning down
u should look for setups like that
my chart is very different than urs coz im using 1h and not ticks and i believe this would work with ticks better but the setup is what u need to look for
i trade a system that is similar to what i posted with a few more indicators. check my thread and ull see what im talking about
good luck if u got any questions feel free to pm me coz i dont check here very often
Attached Image
 
 
  • Post #31
  • Quote
  • Mar 24, 2007 6:41am Mar 24, 2007 6:41am
  •  jimbil
  • | Joined Feb 2007 | Status: Member | 201 Posts
Another messy period.
Attached Image
 
 
  • Post #32
  • Quote
  • Edited at 7:46am Mar 24, 2007 6:52am | Edited at 7:46am
  •  jimbil
  • | Joined Feb 2007 | Status: Member | 201 Posts
Thanks BoxingIsLife.

here are some screenshots of a slow stochastic on the 10 tick cable chart with 50SMA-

This method seems to work well more often than not. Though is not bullet proof - similar to how RSI is not bullet proof at identifying tops & bottoms. Some signals do fail. However, having the condition of only shorting at extrems if price is below 50SMA, & only going long at lower stochastic extreme if price is above 50SMA, should filter out some losing signals.
Attached Image
 
 
  • Post #33
  • Quote
  • Edited at 7:06am Mar 24, 2007 6:55am | Edited at 7:06am
  •  jimbil
  • | Joined Feb 2007 | Status: Member | 201 Posts
Another -
Attached Image
 
 
  • Post #34
  • Quote
  • Mar 24, 2007 7:06am Mar 24, 2007 7:06am
  •  jimbil
  • | Joined Feb 2007 | Status: Member | 201 Posts
One more
Attached Image
 
 
  • Post #35
  • Quote
  • Mar 24, 2007 7:09am Mar 24, 2007 7:09am
  •  jimbil
  • | Joined Feb 2007 | Status: Member | 201 Posts
Again -
Attached Image
 
 
  • Post #36
  • Quote
  • Mar 24, 2007 7:18am Mar 24, 2007 7:18am
  •  jimbil
  • | Joined Feb 2007 | Status: Member | 201 Posts
Some signals are better than others -
Attached Image
 
 
  • Post #37
  • Quote
  • Mar 24, 2007 8:53am Mar 24, 2007 8:53am
  •  ayato
  • | Joined Jan 2007 | Status: Member | 23 Posts
just with a 50 sma and the 00 50 75 levels is not that easy, you have seen how so many times it just will bounce, other times it is just ranging up and down taking one of those leves as a pivot and the times when you see a clean breakout is because there's something else cooking , most likely a support & resistance that happens to be at the same level or a few pips below or above ....
 
 
  • Post #38
  • Quote
  • Mar 24, 2007 9:13am Mar 24, 2007 9:13am
  •  boxingislife
  • Joined Jan 2006 | Status: gamblin wit style | 740 Posts
jimbil ur welcome

i suggest u use more ticks than just 10
10 is too small and the spread will kill u
try 25 or 30 or 50 and even 100 see which one u like the most and which is the one that fits the strategy the most

and post some pictures lol for some reason i love tradestation(so very advanced charting) i have yet to open an account with them but been thinking about it more and more seriously.
 
 
  • Post #39
  • Quote
  • Mar 24, 2007 2:43pm Mar 24, 2007 2:43pm
  •  jimbil
  • | Joined Feb 2007 | Status: Member | 201 Posts
Hi Boxingislife

I know what you mean about lots of noise on 10-tick charts.
However, i prefer small timeframes like this as you can then use smaller stop-losses, trade bigger position sizes, and make more money with less capital.

If you use 10 tick charts you can get away with a 3-5 pip stop-loss (+ spread), if you use a 50 tick chart, naturallyy you have to endure a bigger stop-loss, and thus trade smaller positions.

The messy, whippy ranging periods are the real problem area to using these chart settings.....
 
 
  • Post #40
  • Quote
  • Mar 24, 2007 3:57pm Mar 24, 2007 3:57pm
  •  zawodowiec
  • | Joined Aug 2006 | Status: Member | 307 Posts
Quoting jimbil
Disliked
Another messy whippy period of market price action for GBPUSD.
Ignored
It looked interesting until I saw this chart. How on earth can anyone make money in a situation like this?? Do you actually use this strategy?
 
 
  • Trading Systems
  • /
  • GBPUSD 10-tick chart strategy/idea (in progress)
  • Reply to Thread
    • 1 Page 2 3
    • 1 Page 2 3
0 traders viewing now
  • More
Top of Page
Forex Factory Blog Updated: Alerting All Members
  • Facebook
  • Twitter
About FF
  • Mission
  • Products
  • User Guide
  • Media Kit
  • Blog
  • Contact
FF Products
  • Forums
  • Trades
  • Calendar
  • News
  • Market
  • Brokers
  • Trade Explorer
FF Website
  • Homepage
  • Search
  • Members
  • Report a Bug
Follow FF
  • Facebook
  • Twitter

FF Sister Sites:

  • Metals Mine
  • Energy EXCH
  • Crypto Craft

Forex Factory® is a brand of Fair Economy, Inc.

Terms of Service / ©2022