hey Tmac ,how do you feel ?
i hope that will be this year very good for you and also your the honourable family.
but Tmac .as a matter of fact that in the main the candlestick analysis ,this needs to be done carefully .also on the other part , the today and morrow are religious holiday in the Iran .therefore i have not time for hunting of candlestick formations and then candlestick analysis .
but if need be i will try to the life on this score .
about EURAUD
in all likelihood ,the EURAUD is forming a bottom (in 85xx) for to be completed half-size...
i have a question here...mind u sharing what correlation between those LiteForex Index (LFX) with other majors & crosses ?
thnx again & have a nice day!
Ignored
hi dear all
CandlePower ,by watching the markets ,i noticed something interesting about candlestick charts especially LFX market.
a good dealer especially analyst technical with candlestick analysis method must examine as much as possible in between the all markets and their alternate effects .
CandlePower if need be ,look to "Intermarket Technical Analysis Trading Strategies for the global Stocks ,Bond, Commodity and Currency(FX) markets, written John J.Murphy .
it results from this book (the gift of this book ) ,there is real connection often in between Commodity market and other three markets , Bond, Stocks , Currency (FX) markets in reversed form .one may say always in reversed form .for instance
Commodity =up Bond =down then Stocks= down and Currency=down
Commodity =down Bond =up then Stocks=up and Currency=up
therfore a good dealer FX market must have pay attention to other markets for itself sensitive horizon.
hi dear all
CandlePower ,by watching the markets ,i noticed something interesting about candlestick charts especially LFX market.
a good dealer especially analyst technical with candlestick analysis method...
Ignored
also we must have pay attention to other markets .the LFX market is of interest to me .
in the LFX market we can see only 8 index as follows:
1-USD LFX
2-EUR LFX
3-LFX JPY
4-GBP LFX
5-AUD LFX
6-NZD LFX
7-CAD LFX
8 CHF LFX
also calculations are as follows:
EUR LFX / USD LFX =EURUSD
USD LFX * LFX JPY =USDYEN
GBP LFX / USD LFX =GBPUSD
AUD LFX / USD LFX =AUDUSD
NZD LFX / USD LFX =NZDUSD
USD LFX / CAD LFX =USDCAD
USD LFX / CHF LFX =USDCHF
also calculations are cross pair as follows
GBP LFX / AUD LFX =GBPAUD
LFX JPY * GBP LFX =GBPYEN
EUR LFX / AUD LFX =EURAUD
AUD LFX / NZD LFX =AUDNZD
as a matter of fact we must have used for candlestick analysis a cross pair in FX market for example EURAUD from three candle chart
1-EURUSD
2-AUDUSD
3-EURAUD
but in terms of candlestick analysis for a cross pair in LFX market for example EURUAD , we can use inly from two candle chart
1-EUR LFX
2-AUD LFX
it is safe to say the FX market is with more lag of time than to the LFX market.
i dont know about you but i can see easier and quickly signals in THE LFX than FX .
in the weekly candle chart AUDNZD , we can see a bearish Kabuse pattern note: open prices are important
Ignored
also in the daily candle chart we can see a bearush hanging man pattern and with a bearish doji pattern.
note:open prices are important in this analysis
also we must have pay attention to other markets .the LFX market is of interest to me .
in the LFX market we can see only 8 index as follows:
1-USD LFX
2-EUR LFX
3-LFX JPY
4-GBP LFX
5-AUD LFX
6-NZD LFX
7-CAD LFX
8 CHF LFX
also calculations are as follows:
EUR LFX / USD LFX =EURUSD
USD LFX * LFX JPY =USDYEN
GBP LFX / USD LFX =GBPUSD
AUD LFX / USD LFX =AUDUSD
NZD LFX / USD LFX =NZDUSD
USD LFX / CAD LFX =USDCAD
USD LFX / CHF LFX =USDCHF
also calculations are cross pair as follows
GBP LFX / AUD LFX =GBPAUD
LFX JPY * GBP LFX =GBPYEN
EUR LFX / AUD LFX...
Ignored
thnx a lot bro hussin for yur kind reply...really appreciate it!
Hello everyone,
I really appreciate this thread and have been following as a guest for some time. I hope to be able to become an active participant from now on. Candle stick analysis along with trend lines, fibs, S+R and some moving averages used as S+R is the way I am trading. I also like the larger time frame analysis as I am unable to day trade. My analysis is done between 9pm and midnight GMT. So please keep up the good work.
Thanks everyone and especially Hussin.
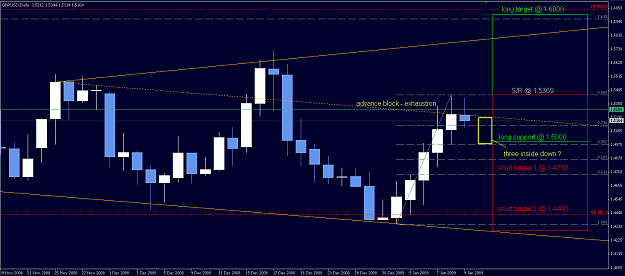
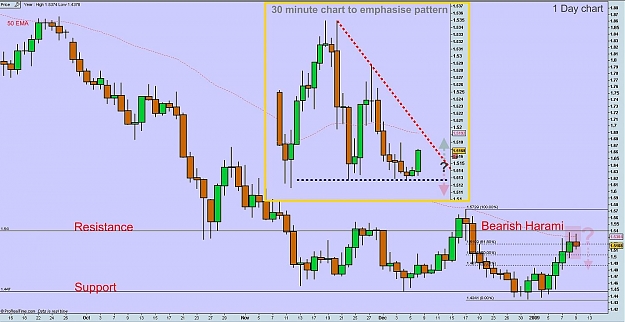
Silverheat has already posted but I wanted to add my view which agrees with the bearish sentiment.
Will the bearish Harami be proven correct by developing into a three inside down?
Steve Nison wrote; the harami pattern is a small real body which is contained within a prior relatively long real body. "Harami" is an old Japanese word for "pregnant." The harami formation is comparable to the Western inside day. An inside day occurs when the highs and lows are within the prior period's range. The harami pattern predicts that the market will separate from its previous trend and requires a narrow opening and closing range (a small real body) to be within the prior wide opening and closing range (that is, a tall real body).
Hello everyone,
I really appreciate this thread and have been following as a guest for some time. I hope to be able to become an active participant from now on. Candle stick analysis along with trend lines, fibs, S+R and some moving averages used as S+R is the way I am trading. I also like the larger time frame analysis as I am unable to day trade. My analysis is done between 9pm and midnight GMT. So please keep up the good work.
Thanks everyone and especially Hussin.
Silverheat has already posted but I wanted to add my view which agrees with the bearish sentiment.
Will the bearish Harami be proven correct by developing into a three inside down?
[size=2]Steve Nison wrote; [i][color=Gray]the harami pattern is a small real body which is contained within a prior relatively long real body. "Harami" is an old Japanese word for "pregnant." The harami formation is comparable to the Western inside day. An inside day occurs when the highs and lows are within the prior period's range. The harami pattern predicts...
Ignored
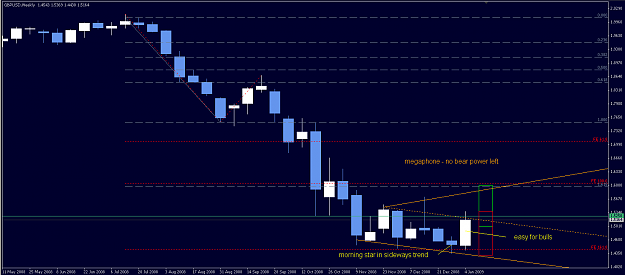
hi dear priceaction
i don't know why? daily candle chart GBPUSD give me view(bearish) but weekly candle chart GBPUSD give me other view (bullish)
hi dear priceaction
i don't know why? daily candle chart GBPUSD give me view(bearish) but weekly candle chart GBPUSD give me other view (bullish)
Ignored
also in the monthly candle chart GBP LFX ,we can see a bullish harmi pattern .of course we know that harami patterns are with low reliability.
but harami patterns will give power to forming other next patterns