[quote=hussin naiji;2442635]or does it matter to you that you see a hammer in combination of a bearish on-neck pattern ?? im not agree with this phrase "the hammer only requires common sense to understand or it is easily identified by the presence of a small body with a shadow at least two times greater than the body "
1) hammer on the last day suggests trend is about to reverse and
1a) the candle occurs right under a descending trendline
1b) candle occurs right at a moving average, while the close is above this MA, the long shadow pushing below the MA suggests the move is losing steam
2) the day before, there was a bullish white candle, but its long lower shadow reveals doubt
3) two days before, the candle also shows the market has doubts because of its long upper shadow
4) an of course, gold is on a longer term downtrend that has been in place since Feb, so the signs suggests this large picture downtrend is about to resume
I had been doing my analysis on EURUSD for tomorrow and jotted down my thoughts. I then stumbled across what you guys had already posted here which I was pleased to see concurred with my thoughts which are ...
Over the Xmas period we’ve seen low volume consolidation which is typical of a holiday period and this has developed into a descending triangle on the daily chart. Coupled with the other points below I shall consider an entry to go short.
I shall make my decision tomorrow morning but I anticipate looking to enter aggressively upon a bounce off the descending line of the triangle (as shown on Bones' chart below) - perhaps a break below a 1hr or 4hr bar. I will then be looking for a break below the baseline of the descending triangle to increase my confidence that this pair is indeed heading South.
1) A descending triangle on the daily EURUSD
2) Five consecutive lower daily highs
3) Bearish outside bar on weekly
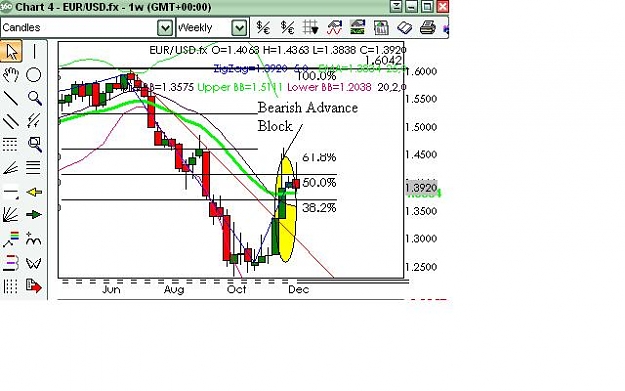
4) Price just below the 50 fib
5) Price at 11 Sept level of support which was eventually broken on 2 Oct
6) Price at significant resistance level (Jul/Aug 07) on weekly chart
7) If price breaks to the downside, 1st target is just below 1.33
I won't post my daily chart as it looks almost identical to Bones' daily chart below. However I can see that Bones, Hussin and Peaches anticipate an even greater drop for this pair.
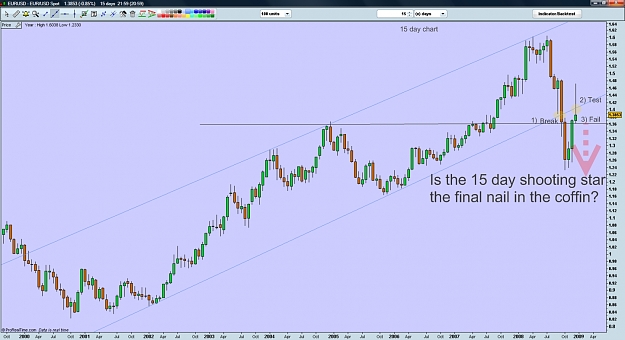
EURGBP is another interesting one, on monthly chart a long candle (marubozu) shot through 0.9 ending on a median line
forming a shooting star or gravestone doji with this weeks close at or below its open could lead to a minor trend reversal (to 0.9?)
edit: though 1.0 is just 300 pips away
Ignored
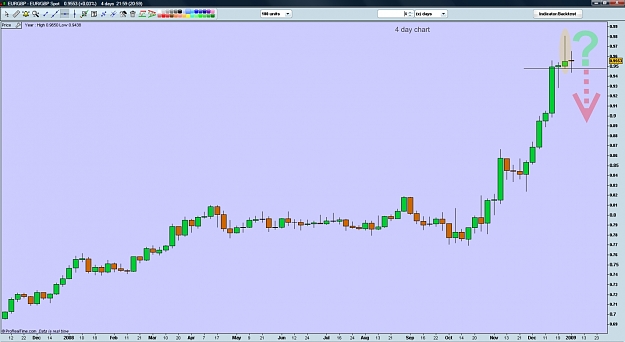
I've looked at this pair through a different lens and this 4 day chart shows a hanging man, closely followed by a shooting star, then 4 days of uncertainty.
I'd like to know what others think of this. Of course let's not forget the point that Silverheat mentioned about a potential historic EURGBP parity being very close by.
With EURUSD looking very bearish, could that add weight to a potential of EURGBP bear move?
I had been doing my analysis on EURUSD for tomorrow and jotted down my thoughts. I then stumbled across what you guys had already posted here which I was pleased to see concurred with my thoughts which are ...
Over the Xmas period we’ve seen low volume consolidation which is typical of a holiday period and this has developed into a descending triangle on the daily chart. Coupled with the other points below I shall consider an entry to go short.
[color=darkslateblue]I shall make...
Ignored
Hmm EU bearish>bullish but I need some confirmations
Many news next week
Strategy: Pending short
I've looked at this pair through a different lens and this 4 day chart shows a hanging man, closely followed by a shooting star, then 4 days of uncertainty.
I'd like to know what others think of this. Of course let's not forget the point that Silverheat mentioned about a potential historic EURGBP parity being very close by.
With EURUSD looking very bearish, could that add weight to a potential of EURGBP bear move?
Ignored
Attached Image (click to enlarge)
On-site guru & also FF member's' psychiatrist, when not drinking tea
1) hammer on the last day suggests trend is about to reverse and
1a) the candle occurs right under a descending trendline
1b) candle occurs right at a moving average, while the close is above this MA, the long shadow pushing below the MA suggests the move is losing steam
2) the day before, there was a bullish white candle, but its long lower shadow reveals doubt
3) two days before, the candle also shows the market has doubts because of its long upper shadow
4) an of course, gold is on a longer...
Ignored
hi philip im not agree with you about a hammer you can explain me what reason was for your view in choice a hammer best regards hussin