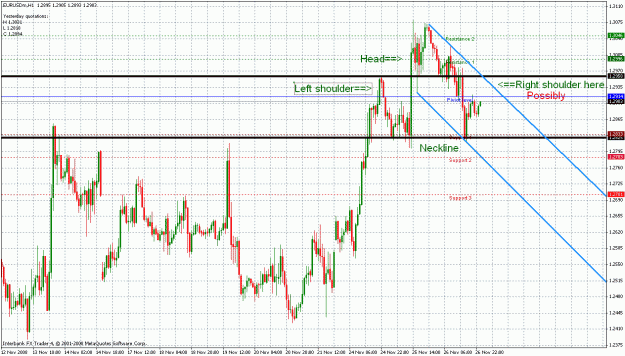
As I remember it, the consensus of the thread was gaps were and are just data breaks. that's all price is anyway as far as we're concerned... whatever the price or data is that OUR broker decides to show us.
True ecn's would be a different story with different issues...
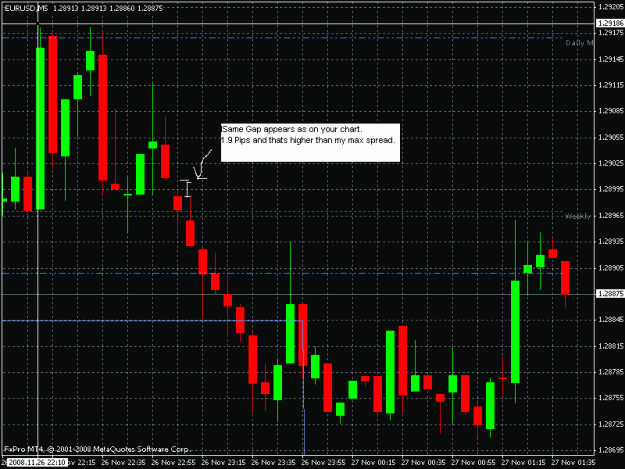
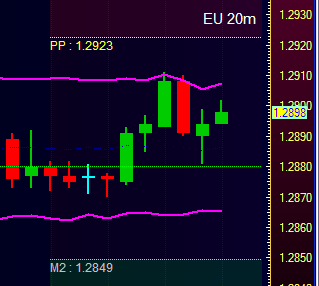
I've looked at psi's gap charts and found that yes there are those little 1-3pip microgaps he says there are, and I initially couldn't match my ibfx charts up to his until i pulled up a demo 5m chart. So my live 5m chart has different candles (and gaps) on it then my demo 5m chart from the SAME broker... but i already knew that and it's not normally an issue.
The reason is just what I stated last night... IBFX gives less priority to their demo servers than their live ones. For example, when price is moving fast, live accounts get the bandwidth priority, also the demo reboot times everyday are different and not nearly as fast. When they do come back up, there's almost always a decent gap on the demo charts that is NOT there on my live charts... you get the picture.
My ibfx platform is really just for order execution anyway as I use my accucharts for everything else chart related including entry/exit triggers. It's a complicated dance sometimes, but I'm used to it. I don't think I've ever seen those microgaps on accucharts but i have to admit i don't look for them either.
So I'm not sure what the point is really about these gaps. If they're only on one brokers charts, and that broker has different gaps on it's own charts between live/demo, how's that supposed to work for anybody else knowing up down or sideways?
FUBAR...