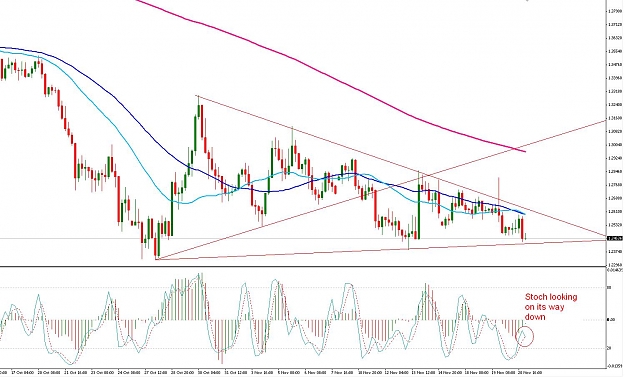
Hey all, i am still in the learning stage but just thought i'd share this chart of EUR/USD 4H TF
I already missed the first triangle around the 10th of november 2008 (with a decent move) but it seems to be lining up nicely for a second shot. From the looks of things it seems to be on its way down (Stochs almost crossing) and could be a good one.
Sadly i wont be taking this trade as fxpro dont support micro lots (i know... very newbie of me to sign up with them without checking if they accepted micro or not ) but my account size wont be able to handle the price range on mini lots.
Anyways, let me know what you guys think.
kad
(soz for the pic quality, wouldnt let me upload at my normal 1920 x 1080 res (4mb+) so had to mess around with it
lol psiholog beat me to it
I already missed the first triangle around the 10th of november 2008 (with a decent move) but it seems to be lining up nicely for a second shot. From the looks of things it seems to be on its way down (Stochs almost crossing) and could be a good one.
Sadly i wont be taking this trade as fxpro dont support micro lots (i know... very newbie of me to sign up with them without checking if they accepted micro or not
Anyways, let me know what you guys think.
kad
(soz for the pic quality, wouldnt let me upload at my normal 1920 x 1080 res (4mb+) so had to mess around with it
lol psiholog beat me to it
Attached Image (click to enlarge)