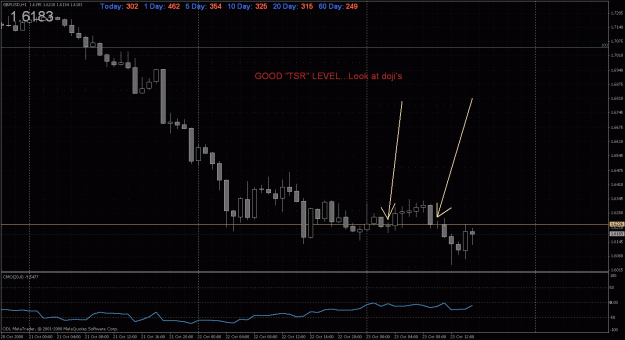
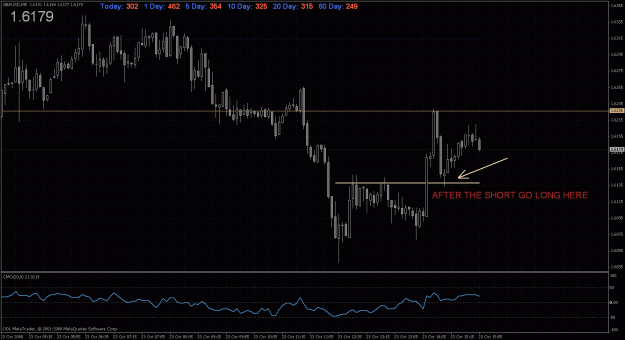
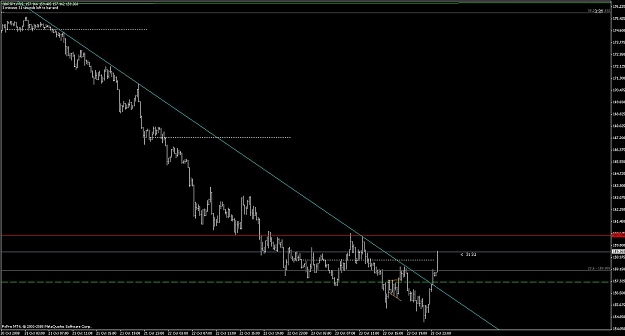
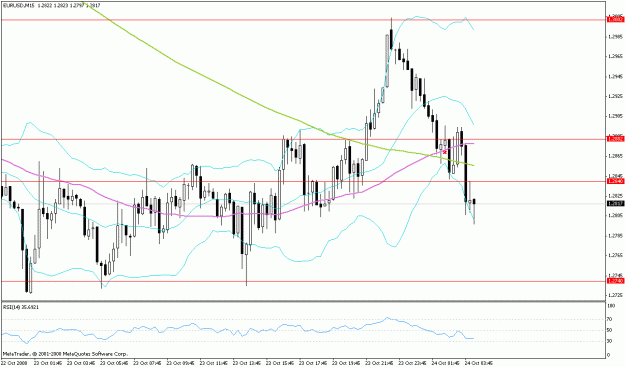
Here is my analysis of price action based on SR or in my lingo...TSR. I really like to see price come into the open and close of certain candles around a particular price level. On the two attached charts (60M and 5M) you can certainly see where opens and closes show the TSR level and a few doji's right on the price level over that long of a period certainly gives me confidence it it. You can also see when it tagged that level and came off showing the sensativity by the wicks. The 5 minute shows that once we had a larger rally and then an immediate retest of resistance, a nice bounce off that level paid as well. I took the long but missed my entry on the short.
Attached Image(s) (click to enlarge)