greenfx08,
..........there is different time frames over there, like 1h, 4h, etc... So, in your scenario if you enter based on weekly IA's status as the instruction states you could still check what's going on on 1h frame. If 1h indicates strong opposite trend for some extended period of time something is definetely wrong.
Orest
Ignored
Orest,
Just in case you've stopped programming in order to sleep, I have an idea for an alternate version of your indicator. We need to keep you working. Sleep is over-rated.
As I've reread Trader 101's post #1 and all the various summaries of the strategy essentials that members are posting, I'm wondering if there's another way the indicator could highlight the two trade trigger setups. The current indicator format lists time snapshots from 1H - 1M and does allow us to successfully trade the trend with a basket of pairs. But we may miss the moment when the Buys and Sell sets are polarized and an opposite pair first 'invades' the other set, triggering a trade entry of two currency pairs. Or, miss the second trade signal when an opposite pair migrates into the opposing anchor position. This triggers the 14 pair basket trade entry.
Is it possible to program the indicator to scan past history for these two trade setups? For example there could be two sets of two collumns of the 14 pairs similar to the current graphic layout. The date in time (or # days past) could be posted at the top of the collumns rather than 1 month, 1 week, etc.. The first two collumns of 14 pairs would be used for strategy #1. The first, collumn 'a', records the recent snapshot when Buy/Sell sets were polarized. In collumn 'b', the current real time 1H list of pairs showing their movement. A trade for two pairs would be entered when the first crossover occurs.
The second pair of columns could represent trade strategy #2. Column 'a' records the snapshot in time when the first opposing pair moves into the opposite sides anchor position. This indicates a trade entry of the basket of 14 pairs should be initiated. The column 'b' is real-time updating to verify that other pairs are following the first to indicate the strength of the change in trend.
Sound and visual alerts could be triggered when the new trade setups occur for #1 or #2.
Well, just food for thought, Orest. I don't know how difficult this would be to code. Our strategy expert, Trader 101, could also clarify if I'm understanding his trade signals correctly.
hey Icicle
thanks a lot for this doc file you made, very usefull indeed
but i guess you inverted the buys pairs and the sells pairs (non ibfx pairs)
thanks
Heh, Aspergers can be fun We are the sort of people who should be kept in darkened rooms, writing product manuals.
If I hadn't written that out I'd still be clueless. I would very much appreciate it if newbies could PM me about anything in there they did not understand. Once you understand something, it is hard to regain the necessary innocence / ignorance to see things from a newbie's point of view.
I have an updated version and will continue to update as we go. Whether or not it is let loose on the public will be up to Trader101.
I have been working on a version of the IBFX multi timeframe indicator too so it will fit on a low resolution screen. I'll release it when I think it is working OK. The little arrows have vanished. I am hoping they will return when the markets are live. I'm not a coder.
I only changed font sizes, some colors and layout. No functionality changes. I hope. But I needed Orest's help to even find the font size bit.
hey Icicle
thanks a lot for this doc file you made, very usefull indeed
but i guess you inverted the buys pairs and the sells pairs (non ibfx pairs)
thanks
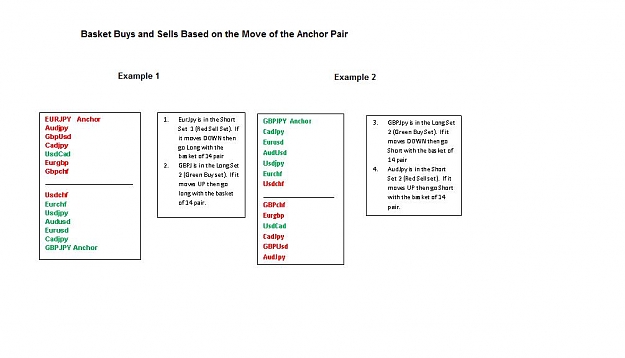
Trader 101 I finally finished reading the entire thread. Hats off to you. This is a great strategy. It looks like one option is to buy or sell the basket of pairs based on the move of the anchor pair. I put a graphic together and hope it attaches o.k.
But basically my understanding is:
1. If the anchor at the top is a red sell and moves down then it's a signal that buying the basket long could be a good option
2. If the anchor at the top is a green buy and moves down then it's a signal that selling the basket short could be a good option
3. If the anchor at the bottom is a red sell and moves up then it's a signal that selling the basket short could be a good option
4. If the anchor at the bottom is a green buy and moves up then it's a signal that buying the basket long could be a good option
Do i have it right? I know there are other things to look at. And right now I'm not looking at the movement of pairs in the middle of the basket.
Jimbop, Yes I executed manually, click by click. The good thing is it has a CLOSE ALL POSITIONS . FXCM have MT4 for mini but not micro. (Don't know if they have changed).
I cannot imagine how much pips we can collect when our Master teach part 2 and 3. I can't wait. (patient is virtue)
May the PIPs be w/ us.
gFX
Ignored
I have an FXCM micro (live) I just have been trading (mostly part 2) successfully with a demo on FXDD. I cant imagine doing it manually. Especially because I trade the entire basket each time. I am going to go live with a new broker just for the MT4 (the max I can go to start is .10 a pip and I may start with .05 to be safe) So I guess FXCM is out for me. I am glad to hear it's working for you though.
Assuming you have ordered your 14 pairs with profitable pairs on top and losers on the bottom, IF the pair you are looking at is moving into profit (ie. going from bottom (-$) to top (+$), you do what it says - if its a BUY, then buy (either that pair, or the basket); if its a SELL, you sell (either that pair or the basket).
If the pair is moving into negative (ie. going from top (+$) to bottom (-$), you do the OPPOSITE of what is says - if its a BUY, then sell (either that pair, or the basket); if its a SELL, you buy (either that pair or the basket).
The other thing is that the opposite anchors will always be the strongest pairs in whatever direction you are trading. If for example, your BUYS are on top and SELLS are on the bottom, this is because the difference between the base and quoted currency strengths/weaknesses (ie. in EUR/JPY, EUR=base, JPY=quoted) is greater than the others, which could be because the EUR is really strong, or the JPY is really weak, or a combination of the two. This will also be the case for the anchor at the bottom, which may be EURUSD which would be a SELL. The reason it is at the bottom and is losing more money than any other SELLs is because it really is the strongest "buy" of the SELL group (if that makes sense). What does that mean? If you look at whats happening, the EUR is beating the pants off of the JPY and the USD. Its really just a long play on the Euro, so what you are seeing on your indicator is that selling the EUR against the USD is about the worst possible pair you could sell, if you are trying to make money. Why? Again, because it is the strongest buy of the SELLS. Of course, we dont trade the indicator, we just use the information it give us to tell us where the best trades may be.
Then, as you move away from the anchors toward the center, your strength differences will be smaller until you get to 0.00 where, at that moment in time...based upon your original entry point for that pair, they are even.
At least this is the way I think of it. Hope this helps.
Leo,
I'm still trying to understand your first assignment. If you describe it by more technical terms it would be great.
Regarding assignment #2 I think I have an easy fix for you.
What if when new week starts (after X hours after new week starts - you tell me) I highlight two new anchor pairs and they stay highlighted all the time on weekly column so you could easily follow their movement?
Orest,
Just in case you've stopped programming in order to sleep, I have an idea for an alternate version of your indicator. We need to keep you working. Sleep is over-rated.
As I've reread Trader 101's post #1 and all the various summaries of the strategy essentials that members are posting, I'm wondering if there's another way the indicator could highlight the two trade trigger setups. The current indicator format lists time snapshots from 1H - 1M and does allow us to successfully trade the trend with a basket of pairs. But we may miss the moment when the Buys and Sell sets are polarized and an opposite pair first 'invades' the other set, triggering a trade entry of two currency pairs. Or, miss the second trade signal when an opposite pair migrates into the opposing anchor position. This triggers the 14 pair basket trade entry.
Is it possible to program the indicator to scan past history for these two trade setups? For example there could be two sets of two collumns of the 14 pairs similar to the current graphic layout. The date in time (or # days past) could be posted at the top of the collumns rather than 1 month, 1 week, etc.. The first two collumns of 14 pairs would be used for strategy #1. The first, collumn 'a', records the recent snapshot when Buy/Sell sets were polarized. In collumn 'b', the current real time 1H list of pairs showing their movement. A trade for two pairs would be entered when the first crossover occurs.
The second pair of columns could represent trade strategy #2. Column 'a' records the snapshot in time when the first opposing pair moves into the opposite sides anchor position. This indicates a trade entry of the basket of 14 pairs should be initiated. The column 'b' is real-time updating to verify that other pairs are following the first to indicate the strength of the change in trend.
Sound and visual alerts could be triggered when the new trade setups occur for #1 or #2.
Well, just food for thought, Orest. I don't know how difficult this would be to code. Our strategy expert, Trader 101, could also clarify if I'm understanding his trade signals correctly.
If that method works for you, then you should pursue it. But if you are going to trade on strengths and weaknesses, you can probably get a better idea of that simply by pulling up charts and making your own observations. If EUR/USD is going up and USD/JPY is going up, you can safely assume that EUR is stronger than JPY, and you can go long EUR/JPY...in theory. This is a very difficult strategy to trade, because these strengths and weaknesses can be very fleeting and temporary. And plus you could be getting in at the top or bottom of the move.
I may be wrong, but I think the basket hedge is going after a different piece of the pie and is presenting you with a balance or imbalance of pairs and giving you an overall market strength (sells or buys) to work with, which over time, should be more reliable.
You can also buy currency meters (software), if you just want to trade Strengths and Weaknesses.
But again, if it works for you, then thats your angle and your edge and you should keep working it.
Ignored
Thank you for your responds, I believe what you have just said makes perfect sense. As with Strength and Weakness, the exact entry and exit must be handled very precises. I have done some back testing on 101's system, this looks more reasonable and reliable.
Assuming you have ordered your 14 pairs with profitable pairs on top and losers on the bottom, IF the pair you are looking at is moving into profit (ie. going from bottom (-$) to top (+$), you do what it says - if its a BUY, then buy (either that pair, or the basket); if its a SELL, you sell (either that pair or the basket).
If the pair is moving into negative (ie. going from top (+$) to bottom (-$), you do the OPPOSITE of what is says - if its a BUY, then sell (either that pair, or the basket); if its a SELL, you buy (either that pair or the basket).
The other thing is that the opposite anchors will always be the strongest pairs in whatever direction you are trading. If for example, your BUYS are on top and SELLS are on the bottom, this is because the difference between the base and quoted currency strengths/weaknesses (ie. in EUR/JPY, EUR=base, JPY=quoted) is greater than the others, which could be because the EUR is really strong, or the JPY is really weak, or a combination of the two. This will also be the case for the anchor at the bottom, which may be EURUSD which would be a SELL. The reason it is at the bottom and is losing more money than any other SELLs is because it really is the strongest "buy" of the SELL group (if that makes sense). What does that mean? If you look at whats happening, the EUR is beating the pants off of the JPY and the USD. Its really just a long play on the Euro, so what you are seeing on your indicator is that selling the EUR against the USD is about the worst possible pair you could sell, if you are trying to make money. Why? Again, because it is the strongest buy of the SELLS. Of course, we dont trade the indicator, we just use the information it give us to tell us where the best trades may be.
Then, as you move away from the anchors toward the center, your strength differences will be smaller until you get to 0.00 where, at that moment in time...based upon your original entry point for that pair, they are even.
At least this is the way I think of it. Hope this helps.
Slade
Ignored
Slade that helps a lot. I've been watching the anchors and also the orest indicator to make my decisions on trading the entire basket. In the 1 week i've been doing this on demo it's worked pretty well. But I think this week I'm also going to look at anchor movement from the strength and buying appeal angle. It reminds me too of Icicle's great write-up where anchors move up into the opposite territory and attempt to displace other pairs and ultimately the opposite anchor (all based on buying and momentum). Visually it's like combat of sorts or chess.
the brians multi index which is onlythe top 8 currencys can be also modified to become 101s muti index then at one quckglance we have an overal confirmation of your great strategy expressed ina visual intereptation i think also
if you like ll do either a video for you or we can utalize the other medium
live together it will make things easier for you to explain i think also
this shows cleary you brilliant strategy without the interference and confusement that is being generated on your great thread
some of this is deliberate i know eventualy they resort to abuse but 101
is the master we are his helpers , despite some peoples opinions get your facts right first
the system of 101 is simle in its purest form it doesn need millions of indicaters eas to use it only to give over the thread now to 101 for his exlanation
system the videos that he produces the dollar index is all you need to
understand this and then listen and wait for the advance course by 101
before his becomes like mine in the past a mess of questions and indicaters eas ect
Just as Dow Jones Industrial Average reflects the general state of American stock market, US Dollar Index (USDXsup>) reflects the general assessment of US Dollar. USDX does it through exchange rates averaging of US Dollar and six most tradable global currencies.
USDX = 50.14348112 × EURUSD−0.576 × USDJPY0.136 × GBPUSD−0.119 × USDCAD0.091 × USDSEK0.042 × USDCHF0.036 Those 20 countries (15 eurozone countries and five other countries, whose currencies are represented in USDX) make up the basis of global trade with the USA, have highly developed currency markets with the quotes which are independently determined by market participants. Besides, many currencies not included into USDX, are traded in close correlation with the currencies included in USDX. USDX value is calculated 24-hours a day, seven days a week.
Currencies and weights used in USDX calculation match the currencies and weights used in calculation of trade weighted US Dollar index by US Fed.
Orest,
I'll try and explain better my idea. After I made the recommendation earlier in the week about highlighting and tracking the anchor pairs, I re-read the basic trading strategy and now think it's most important to first track and record, the points in time when the buy and sell sets settle into their distinct polarized groups (ie, all buys in 1-7 slots and sells in 8-14 slots). The reason is the trade entries are triggered after this setup occurs. These settling 'events' would be displayed in the current pair columns. Pair rankings would be captured at that time of polarization, rather than at arbitrary times of 1 day back, 1 week back, etc..
Trader 101 gave instructions to setup the IA and then wait for the 'settling out' to occur first. This could take 1-2 days. Your indicator currently has coded a way to track and display the fluctuating pip values and ranking of the 14 pairs. So this can skip the wait time previously required as there can be an ongoing monitoring of pair movements. Whenever all pairs group in the polarized position a 'tradeable moment' is impending. Could the indicator look back in history and capture these moments and display perhaps the last two such events? The third column would list the current real-time updating setup based on 1m or tick movement as you currently have.
In this way the recent significant moments when sets were 'settled' would be clearly indicated, and the related trend direction. This would help make sense of the current pair movements. An alert could be triggered when the pairs in the current column became polarized. The trader could then watch for the impending crossover to trade pairs, and watch for the longer development of anchor switching to indicate the 14 pair basket trade.
Leo,
I'm still trying to understand your first assignment. If you describe it by more technical terms it would be great.
Regarding assignment #2 I think I have an easy fix for you.
What if when new week starts (after X hours after new week starts - you tell me) I highlight two new anchor pairs and they stay highlighted all the time on weekly column so you could easily follow their movement?
|
Membership Revoked
|
Joined May 2006
|3,625 Posts
QUOTE> Note: 1) this method is manual.. again manual.. Indicator is fine but the trading is manual. If some of you do not like doing it manual you are free to go. 2) i dont want to see any EA being made out of this system and posted here for showing-off. Indicators are welcome. 3) No mt4 operational questions ex. "where am i going to put the script file?, How do i install this on the chart, or Im a newbie but i like your system please recapitulate the system." Also if you dont understand English dont ask me to translate if for you. 4) Someday somebody will make an FAQ of this sytem. I need volunteer. for that. 5) Lastly, website owner/web administot, forex system stealers, programmer for hire, if your agenda is to steal or herd traffic tell me now in PM so i can charge you, programmers for hire, i cant prevent you. Just make sure to give me a credit on this one on your program and you have to give us a commission for stealing ideas here. I hope we agree on this one then we can always continue. To those who will benefit from this method, my only request is to GIVE CREDIT TO WHERE CREDIT IS DUE this is given unselfishly free. Trader101 – Julius F.
This is a facinating thread. I only discovered it late last week, and was most moved by the above quote from the author 101, made in his first post here. I STRONGLY SUGGEST THAT EVERYONE HERE READ IT AGAIN...... From my coursory scan of the thread I note that EVERY CONDITION that he very sensibly made has been broken.
Well no change there..LoL
I cant pretend that I have had time yet to either read the 1700 posts to date, or fully understand the system, other than it appears to be an interesting alternative way to identify relative strength losers and winners and long term trenders. 101s and others reported success also appears to suggest that it may offer a real trading edge. How flexible it may be in changing market conditions and what its ultimate possibilities may be,is something we will discover. However 101s generosity in sharing is indisputable..
A thread with 1700+ posts in less than a month is in danger of imploding. It gets to the point where is is so convoluted and diverted.. that it fails with its initial objective... of sharing and colaborating and educating...
101 I think forsaw this in his first post. ... QUOTE > 4) Someday somebody will make an FAQ of this sytem. I need volunteer. for that.
Well buddy that day is LONG PAST...With 1700+ posts in less than a month ...and without documentation the declared objectives of whole thing are disintegrating.
Frankly your comments...25th Sept.2008...
Originally Posted by phedrushttp://www.forexfactory.com/images/buttons/viewpost.gif Can anybody explain this system in detail to me please. I am really interested in this but am still a little fuzzy on how it works. please feel free to send me a private message about it or on here.
Thanks all -phedrus
Are you looking for a handout?? you cant find it here. Leave your couch and do something like reading. Your first post to this great thread .... . I dont think my self or the other needs you here....
... are no longer appropriate to the size of the thread at this stage....
One member...ICICLE... is the ONLY guy with the vision and who has taken the time to precis the system into a posted document dispite the 1700 posts and tens of thousands of visits that members and guests have paid here. Can I suggest that he and Brian and the others who have tried to define and precis 101s ideas and those of the key contributers here, combine to deliver ?
Personally I dont give a Flying Fandango...But it would be nice to see SOME leadership and maturity exercised on this matter...
Orest,
I'll try and explain better my idea. After I made the recommendation earlier in the week about highlighting and tracking the anchor pairs, I re-read the basic trading strategy and now think it's most important to first track and record, the points in time when the buy and sell sets settle into their distinct polarized groups (ie, all buys in 1-7 slots and sells in 8-14 slots). The reason is the trade entries are triggered after this setup occurs. These settling 'events' would be displayed in the current pair columns. Pair rankings would be captured at that time of polarization, rather than at arbitrary times of 1 day back, 1 week back, etc..
Trader 101 gave instructions to setup the IA and then wait for the 'settling out' to occur first. This could take 1-2 days. Your indicator currently has coded a way to track and display the fluctuating pip values and ranking of the 14 pairs. So this can skip the wait time previously required as there can be an ongoing monitoring of pair movements. Whenever all pairs group in the polarized position a 'tradeable moment' is impending. Could the indicator look back in history and capture these moments and display perhaps the last two such events? The third column would list the current real-time updating setup based on 1m or tick movement as you currently have.
In this way the recent significant moments when sets were 'settled' would be clearly indicated, and the related trend direction. This would help make sense of the current pair movements. An alert could be triggered when the pairs in the current column became polarized. The trader could then watch for the impending crossover to trade pairs, and watch for the longer development of anchor switching to indicate the 14 pair basket trade.
Does this make sense or seems doable?
LeoM
Ignored
This sounds good to me. If it able to be done then we know exactly (what day and time) when those pairs were settled. And we can closely follow Trader101 guide lines.
I want to say that this must be one of the best systems. I only use what Trader101 provieded in the first post and nothing more. And I make pips/money like crazy. Almost to good to be true
One member...ICICLE... is the ONLY guy with the vision and who has taken the time to precis the system into a posted document dispite the 1700 posts and tens of thousands of visits that members and guests have paid here. Can I suggest that he and Brian and the others who have tried to define and precis 101s ideas and those of the key contributers here, combine to deliver ?
Personally I dont give a Flying Fandango...But it would be nice to see SOME leadership and maturity exercised on this matter...
Ignored
This post had me rolling round giggling for all sorts of reasons. Not least of which - it caused my flatmate to pause her cake-munching for a second and point out once again that I only wrote the thing because I am "too retarded" to understand it otherwise.
I am documenting it, but its an ongoing thing. I'm currently awaiting permission to steal the contents of a couple of posts to incorporate in version three, and many people have helped by sending me questions, software links etc. as well. I'm hoping there won't be any need for a faq by the time I'm done / gotten interested in something else. And while people are sending me their questons they are not cluttering the thread with them, thus improving thread focus, and they are also helping improve documentation.
If I wanted a real challenge, I'd be explaining Brijon's method
I follow this thread with high interest and want to know, which
timeframe is your favourite regarding the settle down process
mentioned by trader 101 in the first post.
 Simple Trading Method with trader101