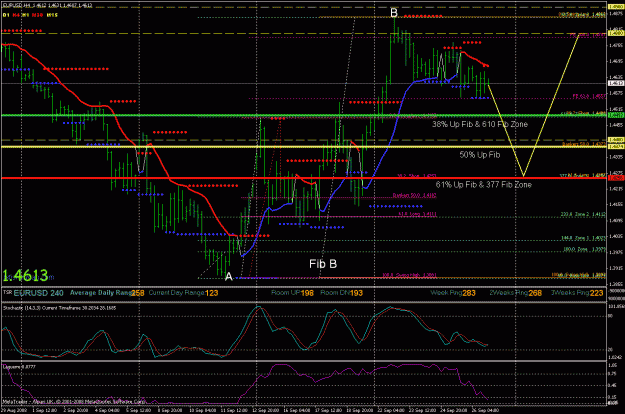
The first chart is the EUR 4 hr chart. We've been in an up move from point A to point B. Point be just happens to be the 987 Fib Zone of the current up move and we are starting to retrace. I've pulled Fib B but it is really not a valid fib until price comes back and reverses at one of the inner fib retracement levels (38% lime, 50% yellow and 61% red). If price goes down and then reverses at one of the inner fib levels then we can pull our Fib Expansion levels from point A to point B. I show the yellow zig zag line just so you can see what I mean by going down and reversing at one of the inner fibs. I really don't know which fib it will bounce form or even if it will reverse at one of those fib levels. This post is educational in nature and not meant to be trade advise.
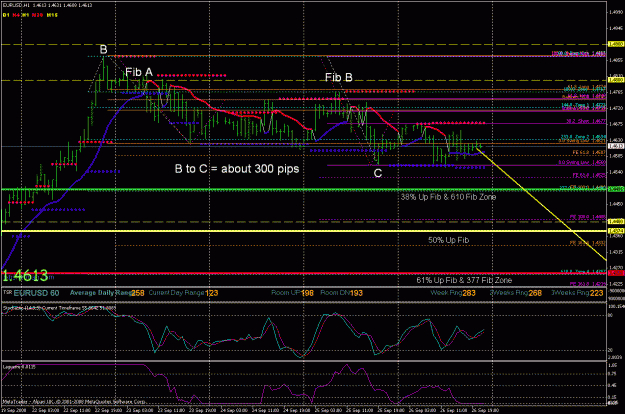
Ok..chart 2 is the 1 hr chart. The first thing to note is from point B to point C there is about 300 pips. So gives me the first clue to start pulling Fib Zones and fibs from the top in the down direction. As you can see we have Fib Zone and fib harmony. We've broken down through the 233 Fib Zone and we've retraced. Fib B has respect at the 38% retracement level. Now notice that the 38 lime,50 yellow and 61 red fib levels from the up move from the 4hr chart are below current price. If price goes down to one of these inner fibs and reverses to the upside the up Fib will be validated and price may start to move up in accordance with the up Fib Zones from the 4hr chart. If price continues in the down direction we will watch for a reversal at each inner Fib level. If it goes below the 61% inner fib, then price may contiune in the down move and would pull additional fibs when we get new swing lows.
Ok..chart 2 is the 1 hr chart. The first thing to note is from point B to point C there is about 300 pips. So gives me the first clue to start pulling Fib Zones and fibs from the top in the down direction. As you can see we have Fib Zone and fib harmony. We've broken down through the 233 Fib Zone and we've retraced. Fib B has respect at the 38% retracement level. Now notice that the 38 lime,50 yellow and 61 red fib levels from the up move from the 4hr chart are below current price. If price goes down to one of these inner fibs and reverses to the upside the up Fib will be validated and price may start to move up in accordance with the up Fib Zones from the 4hr chart. If price continues in the down direction we will watch for a reversal at each inner Fib level. If it goes below the 61% inner fib, then price may contiune in the down move and would pull additional fibs when we get new swing lows.
Attached Image(s) (click to enlarge)