• Home
  • Forums
  • Trades
  • News
  • Calendar
  • Market
  • Brokers
  • Login
  • Join
  • User/Email: Password:
  • 12:01am
Menu
  • Forums
  • Trades
  • News
  • Calendar
  • Market
  • Brokers
  • Login
  • Join
  • 12:01am
Sister Sites
  • Metals Mine
  • Energy EXCH
  • Crypto Craft

Options

Bookmark Thread

First Page First Unread Last Page Last Post

Print Thread

Similar Threads

Learning From Unsuccessful Mouteki Trades - The Search for Filters... 262 replies

Jumper's journal of Mouteki trading 74 replies

Mouteki Alert Service Trades 3 replies

Mouteki/Vegas 4 Hour/Price Action 32 replies

Kalesh's journal of Mouteki Trading 25 replies

  • Trading Journals
  • /
  • Reply to Thread
  • Subscribe
  • 58
Attachments: Nchosen's trades by Mouteki rules
Exit Attachments
Tags: Nchosen's trades by Mouteki rules
Cancel

Nchosen's trades by Mouteki rules

  • Last Post
  •  
  • Page 1 23456 8
  • Page 1 234 8
  •  
  • Post #1
  • Quote
  • First Post: Edited Sep 22, 2006 5:50am Sep 21, 2006 10:55am | Edited Sep 22, 2006 5:50am
  •  nchosen
  • | Joined Jun 2006 | Status: Member | 172 Posts
Hi,

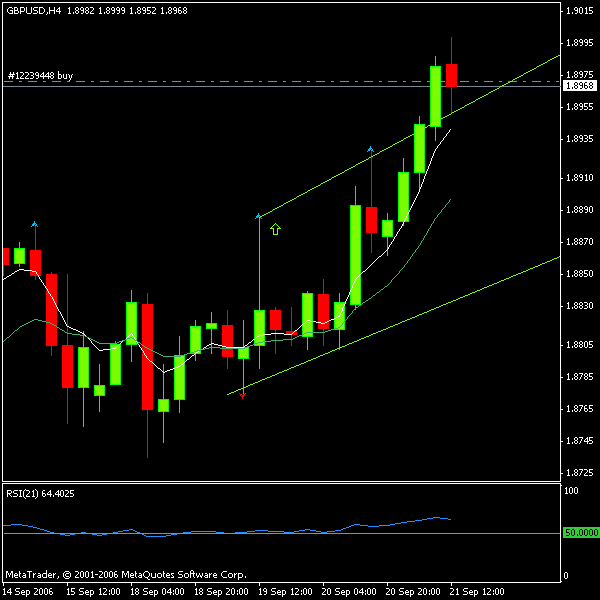
This is my first trade on my demo account.

Bar opened 1.8982
Projected 98 pips
TP @1.9080 (with EA ManageTakeProfit)
SL 36 (with EA ManageTakeProfit)

Trade #1

EDIT #1: this a false trade, because supply line is drawn wrong (sloping up). Seems to be in profit. There is a proper signal 5 candles before, from which this trade seems to get power too.

EDIT #2: Proper setup, which I was late because of my false setup, should be
Bar opened 1.8874
Projected 163 pips (hit)
TP @1.9037 (already hit)
SL 54

Trade closed:
SL @1.9033 +62 pips (not original TP )
Attached Image
  • Post #2
  • Quote
  • Sep 21, 2006 11:13am Sep 21, 2006 11:13am
  •  Panjan
  • | Joined Aug 2006 | Status: Member | 179 Posts
Enchosen,

Loooks like a very nice chart you've there but how the trade comes out?

The about the EA for profit manager...how does it work and mind for sharing?
Shah For every action there is an equal and opposite reaction.....
 
 
  • Post #3
  • Quote
  • Sep 21, 2006 11:42am Sep 21, 2006 11:42am
  •  nchosen
  • | Joined Jun 2006 | Status: Member | 172 Posts
Quoting Panjan
Disliked
Enchosen,

Loooks like a very nice chart you've there but how the trade comes out?

The about the EA for profit manager...how does it work and mind for sharing?
Ignored
I just got in that trade. Currently -11 pips.

You can find that EA in Mouteki thread. Here's the link http://www.forexfactory.com/forexfor...&page=62&pp=15 and #928.

Hope it helps.
 
 
  • Post #4
  • Quote
  • Sep 21, 2006 11:59am Sep 21, 2006 11:59am
  •  minute
  • | Joined Jun 2006 | Status: Member | 377 Posts
Hi, man, home make some demo money off this trade but and I hope you don't mind me saying, you are drawing the line incorrectly. That line needs to be sloping down and the signal had already occurred.

That is if you are wanting to stick to Mouteki method.

Good luck in trading. I am using Mouteki as well.
 
 
  • Post #5
  • Quote
  • Sep 21, 2006 12:08pm Sep 21, 2006 12:08pm
  •  nchosen
  • | Joined Jun 2006 | Status: Member | 172 Posts
Quoting minute
Disliked
Hi, man, home make some demo money off this trade but and I hope you don't mind me saying, you are drawing the line incorrectly. That line needs to be sloping down and the signal had already occurred.

That is if you are wanting to stick to Mouteki method.

Good luck in trading. I am using Mouteki as well.
Ignored
Sorry, but I do not remember that the line should be sloping to any direction. Could you point me out where that is mentioned?
 
 
  • Post #6
  • Quote
  • Edited Sep 22, 2006 3:45am Sep 21, 2006 12:10pm | Edited Sep 22, 2006 3:45am
  •  nchosen
  • | Joined Jun 2006 | Status: Member | 172 Posts
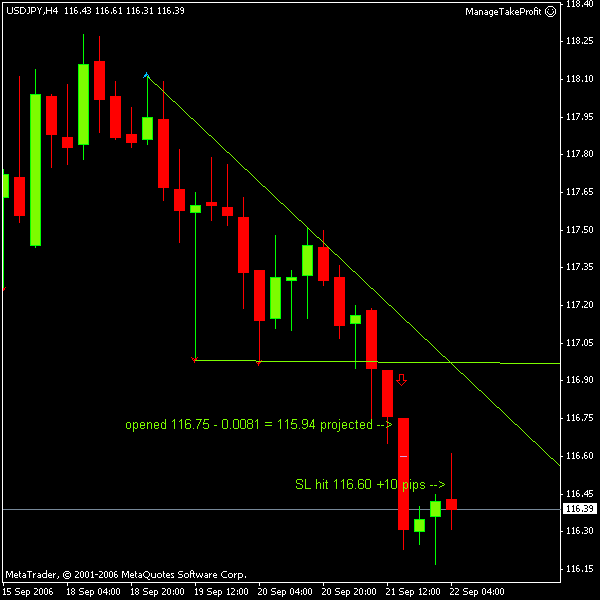
Trade #2

Bar opened 116.75
Projected 81 pips
TP @115.94 (with EA ManageTakeProfit)
SL 40 (with EA ManageTakeProfit)

SL hit 116.60 +10 pips
2006.09.22 06:52
Attached Image
 
 
  • Post #7
  • Quote
  • Sep 21, 2006 12:14pm Sep 21, 2006 12:14pm
  •  nchosen
  • | Joined Jun 2006 | Status: Member | 172 Posts
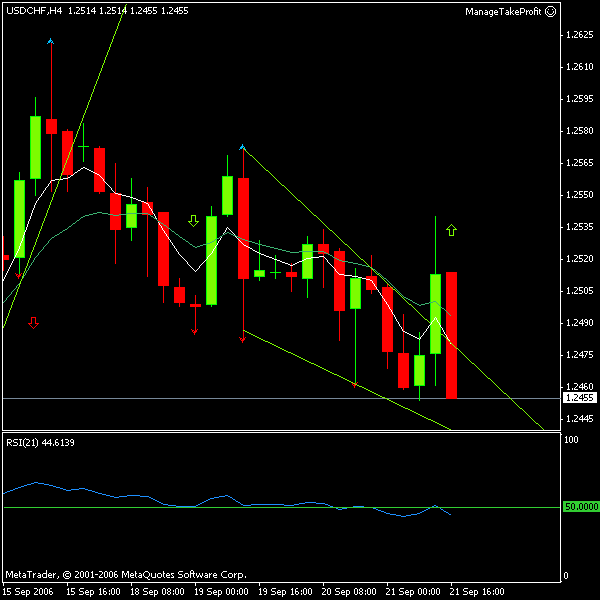
Trade #3

Bar opened 1.2514
Projected 41 pips
TP @1.2555 (with EA ManageTakeProfit)
SL 20 (with EA ManageTakeProfit)

SL was already hit
-20 pips<!-- / message --><!-- attachments -->
Attached Image
 
 
  • Post #8
  • Quote
  • Sep 21, 2006 12:19pm Sep 21, 2006 12:19pm
  •  rover
  • | Joined Aug 2006 | Status: Member | 12 Posts
dear friend,

it better you read the first pages from muteki thread ,
your line of support and demand are wrong.
rover all the time
 
 
  • Post #9
  • Quote
  • Sep 21, 2006 12:20pm Sep 21, 2006 12:20pm
  •  minute
  • | Joined Jun 2006 | Status: Member | 377 Posts
Quoting nchosen
Disliked
Sorry, but I do not remember that the line should be sloping to any direction. Could you point me out where that is mentioned?
Ignored
See all the powerpoint presentations that Mouteki has provided. You will find the upper line always slopes down, but you are right, I don't think he actually specifically says it.
 
 
  • Post #10
  • Quote
  • Sep 21, 2006 12:33pm Sep 21, 2006 12:33pm
  •  nchosen
  • | Joined Jun 2006 | Status: Member | 172 Posts
Quoting rover
Disliked
dear friend,

it better you read the first pages from muteki thread ,
your line of support and demand are wrong.
Ignored
Rover,

Thank you for your comments, but could you be more specific? I am willing to take any advice and comments, because I am learning.

Thanks.
 
 
  • Post #11
  • Quote
  • Sep 21, 2006 12:35pm Sep 21, 2006 12:35pm
  •  nchosen
  • | Joined Jun 2006 | Status: Member | 172 Posts
Quoting minute
Disliked
See all the powerpoint presentations that Mouteki has provided. You will find the upper line always slopes down, but you are right, I don't think he actually specifically says it.
Ignored
You too are right. They are systemically sloping. I did not think that at all, when drawing lines. I have to throw a question to Mouteki thread to be sure. Thanks.
 
 
  • Post #12
  • Quote
  • Sep 21, 2006 12:39pm Sep 21, 2006 12:39pm
  •  minute
  • | Joined Jun 2006 | Status: Member | 377 Posts
Quoting nchosen
Disliked
You too are right. They are systemically sloping. I did not think that at all, when drawing lines. I have to throw a question to Mouteki thread to be sure. Thanks.
Ignored
I am sure it has been mentioned before very early in the thread, in fact I remember it, because I wondered the same thing.
 
 
  • Post #13
  • Quote
  • Sep 21, 2006 12:43pm Sep 21, 2006 12:43pm
  •  nchosen
  • | Joined Jun 2006 | Status: Member | 172 Posts
Quoting minute
Disliked
I am sure it has been mentioned before very early in the thread, in fact I remember it, because I wondered the same thing.
Ignored
I will recheck it for sure. I am glad of posting my trades if I learned only this one thing.

Thanks.
 
 
  • Post #14
  • Quote
  • Edited 1:35pm Sep 21, 2006 12:43pm | Edited 1:35pm
  •  PeterFM
  • Joined Apr 2006 | Status: Suaviter in modo, fortiter in re | 1,851 Posts
Quoting nchosen
Disliked
Sorry, but I do not remember that the line should be sloping to any direction. Could you point me out where that is mentioned?
Ignored
Hi
You need to understand what you're looking at, so let's get some definitions outlined.

The top line is called the Supply Line for this reason; Supply is exceeding demand so the Supply price will keep falling until it reaches a point where buyers start buying again. Therefore the Supply Line will always slope down. You must draw your lines from right to left, following the Mouteki rules; ie find the highest point (of Resistance) that is nearest the current price that has 2 bars to the left and bars to the right of it that have lower highs, this is Point 1. You may have to look back into the past to ensure that you can apply these rules to Point 2.

The lower line is called the Demand Line for this reason; Demand is exceeding Supply so the Demand Price will keep rising until it reaches a point where buyers lose interest and start selling. Therefore the Demand Line will always be rising. You must draw your lines from right to left, following the Mouteki rules; ie find the lowest point (of Support) that is nearest the current price that has 2 bars to the left and bars to the right of it that have higher lows, this is Point 1. You may have to look back into the past to ensure that you can apply these rules to Point 2.

Hope this helps, but if you don't go back and read the manual, and Powerpoint Presentations, properly, I'm afraid you're bound to fail.

Peter
Attached Image
 
 
  • Post #15
  • Quote
  • Sep 21, 2006 2:07pm Sep 21, 2006 2:07pm
  •  nchosen
  • | Joined Jun 2006 | Status: Member | 172 Posts
Quoting PeterFM
Disliked
Hi
You need to understand what you're looking at, so let's get some definitions outlined.

The top line is called the Supply Line for this reason; Supply is exceeding demand so the Supply price will keep falling until it reaches a point where buyers start buying again. Therefore the Supply Line will always slope down. You must draw your lines from right to left, following the Mouteki rules; ie find the highest point (of Resistance) that is nearest the current price that has 2 bars to the left and bars to the right of it that have lower highs, this is Point 1. You may have to look back into the past to ensure that you can apply these rules to Point 2.

The lower line is called the Demand Line for this reason; Demand is exceeding Supply so the Demand Price will keep rising until it reaches a point where buyers lose interest and start selling. Therefore the Demand Line will always be rising. You must draw your lines from right to left, following the Mouteki rules; ie find the lowest point (of Support) that is nearest the current price that has 2 bars to the left and bars to the right of it that have higher lows, this is Point 1. You may have to look back into the past to ensure that you can apply these rules to Point 2.

Hope this helps, but if you don't go back and read the manual, and Powerpoint Presentations, properly, I'm afraid you're bound to fail.

Peter
Ignored
Thanks Peter,

I learned a valuable lesson here. I will also definitely recheck all the documentations.
 
 
  • Post #16
  • Quote
  • Sep 21, 2006 2:11pm Sep 21, 2006 2:11pm
  •  nchosen
  • | Joined Jun 2006 | Status: Member | 172 Posts
Quoting minute
Disliked
I am sure it has been mentioned before very early in the thread, in fact I remember it, because I wondered the same thing.
Ignored
Minute,

I posted a question at Mouteki thread regarding this matter and got few immediate comments stating that indeed demand line is sloping up and supply line down.

Thank you for pointing that up.
 
 
  • Post #17
  • Quote
  • Edited Sep 22, 2006 3:56am Sep 21, 2006 2:25pm | Edited Sep 22, 2006 3:56am
  •  nchosen
  • | Joined Jun 2006 | Status: Member | 172 Posts
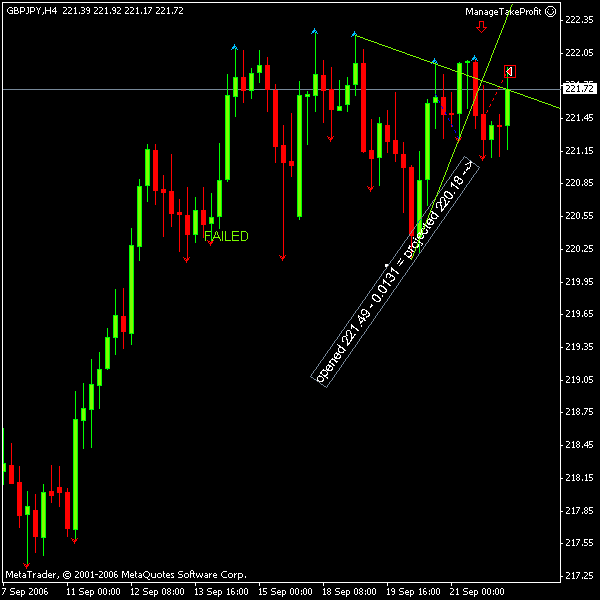
Trade #4

Bar opened 221.49
Projected 131 pips
TP @220.18 (with EA ManageTakeProfit)
SL 43 (with EA ManageTakeProfit)

SL hit @22.88 -43 pips
2006.09.22 06:52

note: 3 pips away from +40 pips -> +10 pips profit locked
Attached Image
 
 
  • Post #18
  • Quote
  • Sep 21, 2006 6:11pm Sep 21, 2006 6:11pm
  •  PeterFM
  • Joined Apr 2006 | Status: Suaviter in modo, fortiter in re | 1,851 Posts
Quoting nchosen
Disliked
Thanks Peter,
I learned a valuable lesson here. I will also definitely recheck all the documentations.
Ignored
Glad I could help, I was worried the image may have confused the issue. It wasn't designed to show where Points #1 & #2 are when looking for the trend, but to show how to select the correct highs & lows as you checked back along the chart.

One other thing I would suggest, just while you're learning this, is get rid of the Moving Averages and the RSI at the bottom of the page. The quicker you learn to read price action the better for you.

Oscillators and MAs lag behind the action, and this method is designed to help you spot a breakout as it happens. If you wait for confirmation, you could miss the start of the break and then if it is a false breakout you'll be getting into the trade just as it's about to turn bad.

The only value they have is to warn you of the end of a trend, they are never as reliable at the beginning.

Peter
 
 
  • Post #19
  • Quote
  • Sep 22, 2006 4:03am Sep 22, 2006 4:03am
  •  nchosen
  • | Joined Jun 2006 | Status: Member | 172 Posts
Quoting PeterFM
Disliked
Glad I could help, I was worried the image may have confused the issue. It wasn't designed to show where Points #1 & #2 are when looking for the trend, but to show how to select the correct highs & lows as you checked back along the chart.

One other thing I would suggest, just while you're learning this, is get rid of the Moving Averages and the RSI at the bottom of the page. The quicker you learn to read price action the better for you.

Oscillators and MAs lag behind the action, and this method is designed to help you spot a breakout as it happens. If you wait for confirmation, you could miss the start of the break and then if it is a false breakout you'll be getting into the trade just as it's about to turn bad.

The only value they have is to warn you of the end of a trend, they are never as reliable at the beginning.

Peter
Ignored
Thanks Peter,

I just got rid of those indicators that were left hanging from my previous chart setups.
 
 
  • Post #20
  • Quote
  • Edited 10:44am Sep 22, 2006 4:20am | Edited 10:44am
  •  nchosen
  • | Joined Jun 2006 | Status: Member | 172 Posts
Results so far:


Trade #1: closed +62 pips
Trade #2: closed +10 pips
Trade #3: closed -20 pips
Trade #4: closed -43 pips
Trade #5: closed -27 pips
Trade #6: still open
Trade #7: closed -49 pips

Total L/P: -67 pips
 
 
  • Trading Journals
  • /
  • Nchosen's trades by Mouteki rules
  • Reply to Thread
    • Page 1 23456 8
    • Page 1 234 8
0 traders viewing now
  • More
Top of Page
  • Facebook
  • Twitter
About FF
  • Mission
  • Products
  • User Guide
  • Media Kit
  • Blog
  • Contact
FF Products
  • Forums
  • Trades
  • Calendar
  • News
  • Market
  • Brokers
  • Trade Explorer
FF Website
  • Homepage
  • Search
  • Members
  • Report a Bug
Follow FF
  • Facebook
  • Twitter

FF Sister Sites:

  • Metals Mine
  • Energy EXCH
  • Crypto Craft

Forex Factory® is a brand of Fair Economy, Inc.

Terms of Service / ©2023