Barak- Let me tell tell you how I trade and maybe it will help. For me, there is a daily comparison to what is happening on the H4 & the daily/monthly trend.
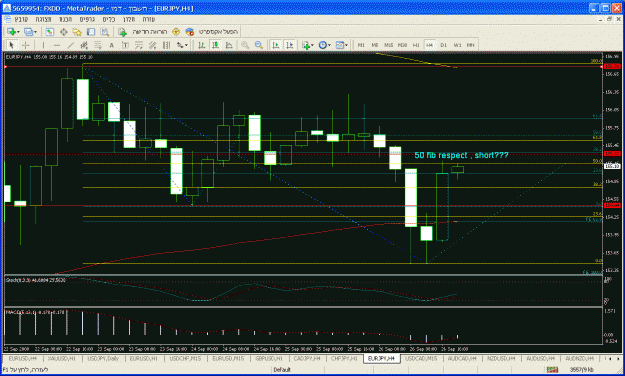
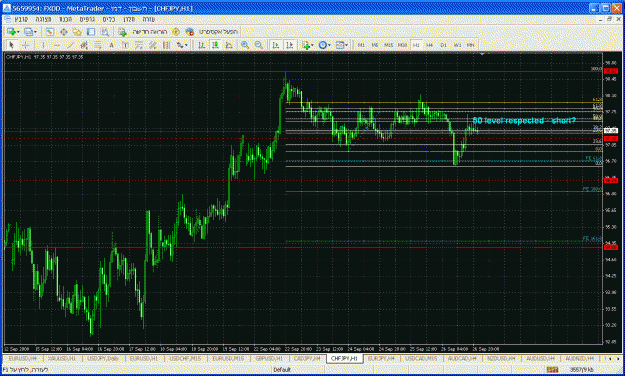
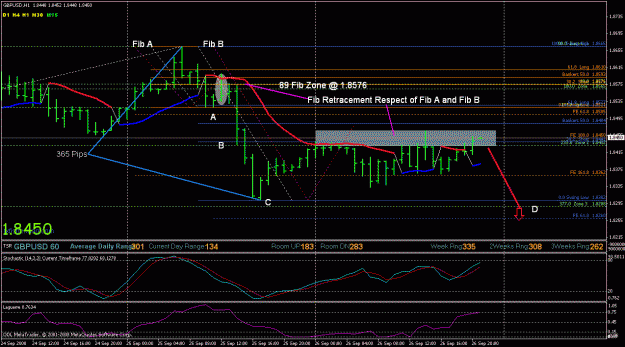
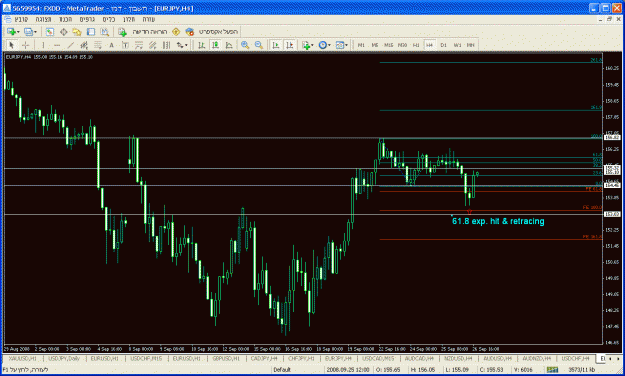
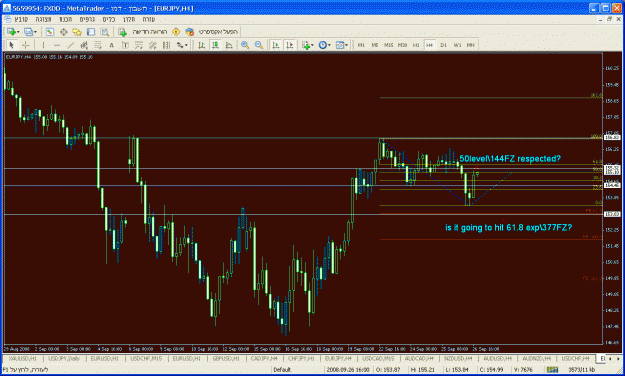
"when a move finished and we start looking at the oposite direction...the pair was respecting 61.8 level of the big move it made , began going south , but then turned around respected that level again & overlapped it to 377 level , again moved south ... and now turned again". What does the higher timeframe tell you it was doing? Remember you are weighing the direction of the daily against what is going on with the 4HR chart. Is the daily respecting it's own fib pattern? Are they both heading in the same direction (the highest probability trade)? Charting is an art and like all art it takes experience and time to develop your talent at feeling the emerging patterns. This thread isn't that old and it takes a lot of perserverance and patience to find the groove. PLUS the market is crazy right now....central banks are trying to stabilize the market and I don't trust any trades right now. It may be nothing but it looks to me like they're locking down the moves.
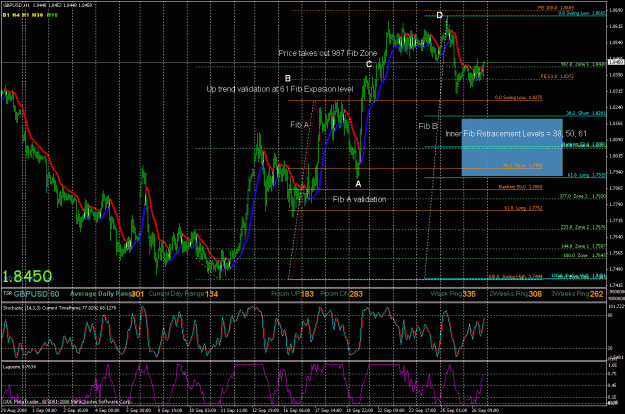
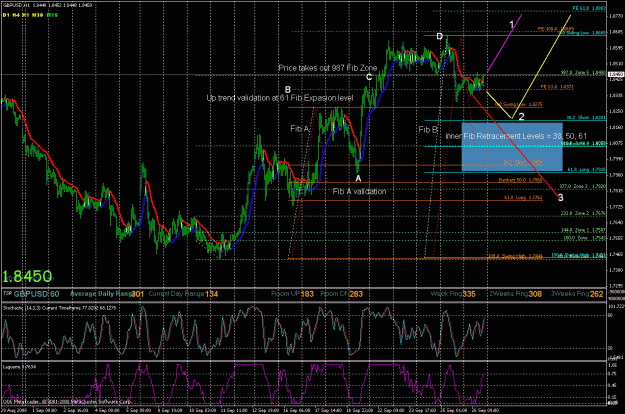
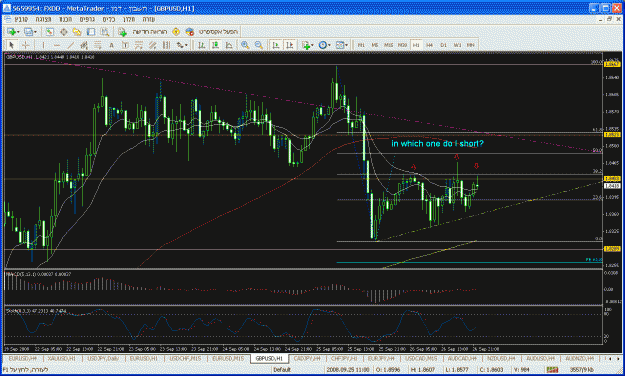
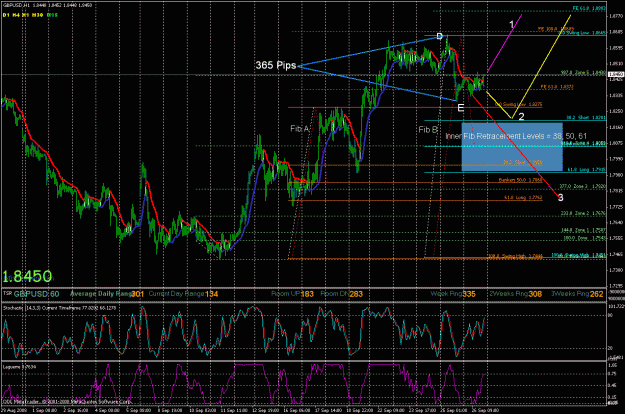
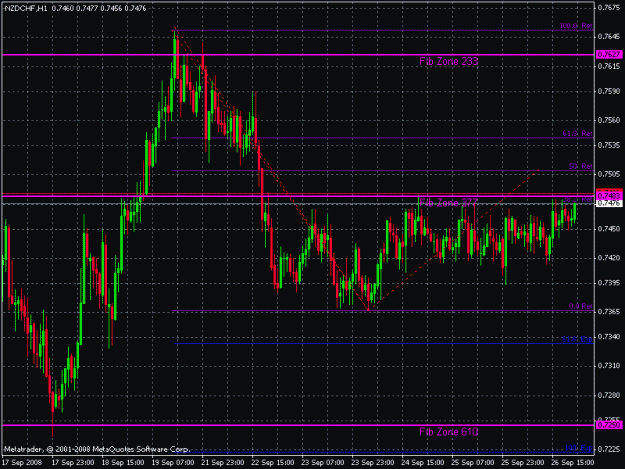
how many respects of fib levels , fib zones & fib expensions has to be before we develope interest for the pair? For me, it's one because I trade 1-2-3 patterns (a move, a retracement, a move to FE 61.8%, a small trade down and a larger trade up). It appears M waits for the 2nd retrace and then takes the trade. I also look for things like candle patterns and inside bars at those levels to see if I can up the probability.
Lastly and probably most importantly, trading is about probabilities and consistency.
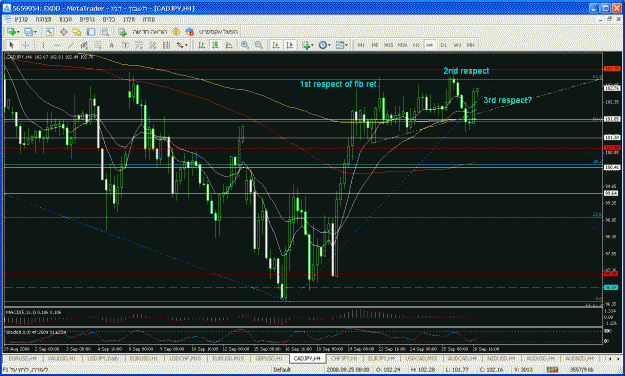
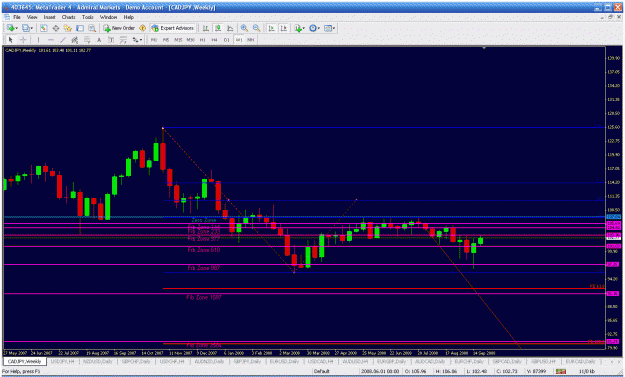
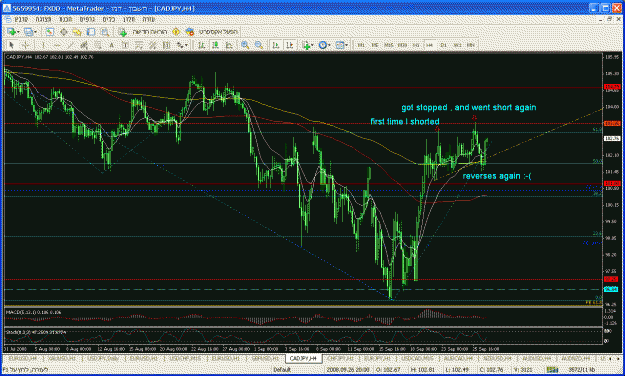
I'd try to help more but my platform doesn't have cad/jpy.
"when a move finished and we start looking at the oposite direction...the pair was respecting 61.8 level of the big move it made , began going south , but then turned around respected that level again & overlapped it to 377 level , again moved south ... and now turned again". What does the higher timeframe tell you it was doing? Remember you are weighing the direction of the daily against what is going on with the 4HR chart. Is the daily respecting it's own fib pattern? Are they both heading in the same direction (the highest probability trade)? Charting is an art and like all art it takes experience and time to develop your talent at feeling the emerging patterns. This thread isn't that old and it takes a lot of perserverance and patience to find the groove. PLUS the market is crazy right now....central banks are trying to stabilize the market and I don't trust any trades right now. It may be nothing but it looks to me like they're locking down the moves.
how many respects of fib levels , fib zones & fib expensions has to be before we develope interest for the pair? For me, it's one because I trade 1-2-3 patterns (a move, a retracement, a move to FE 61.8%, a small trade down and a larger trade up). It appears M waits for the 2nd retrace and then takes the trade. I also look for things like candle patterns and inside bars at those levels to see if I can up the probability.
Lastly and probably most importantly, trading is about probabilities and consistency.
I'd try to help more but my platform doesn't have cad/jpy.