Part of me would like to see another 100 pips up to give a good clear right shoulder to the weekly chart and balance things out... sort of restore form and balance to the cosmos and all that sort of esoteric blabber.
But then again, who cares?
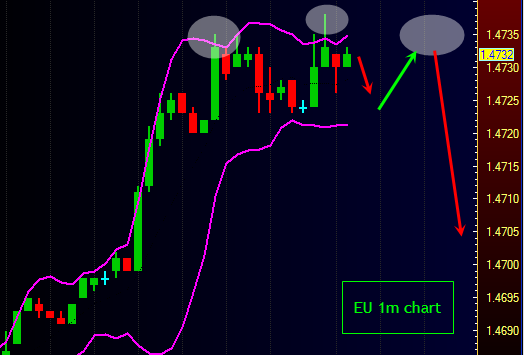
Anyway, here's my trend reversal chart based on the 1m TF. I have found it to be very ambiguous in depicting all past, current, and future price movements. The Head and Shoulders pattern on the 1m is one of the most powerful patterns known to man.
Even in ancient times, when one Neanderthal picked up a rock and wielded it on the upper regions of his fellow Neanderthal (hence the name) in disputes over bits of uncooked meat or Troglydite women, it only took a minute to produce sudden reversals in fortune for one or the other of them (hence the TF).
Of course this is only valid if price does what I have indicated. If it does something else instead, then just forget it.
But then again, who cares?
Anyway, here's my trend reversal chart based on the 1m TF. I have found it to be very ambiguous in depicting all past, current, and future price movements. The Head and Shoulders pattern on the 1m is one of the most powerful patterns known to man.
Even in ancient times, when one Neanderthal picked up a rock and wielded it on the upper regions of his fellow Neanderthal (hence the name) in disputes over bits of uncooked meat or Troglydite women, it only took a minute to produce sudden reversals in fortune for one or the other of them (hence the TF).
Of course this is only valid if price does what I have indicated. If it does something else instead, then just forget it.
Attached Image
FUBAR...