hi, i went short where price hit resistance at places marked with x with stop loss of 20 pips. i stopped out both times. did i make a mistake somewhere? did anyone lose money too?
Ignored
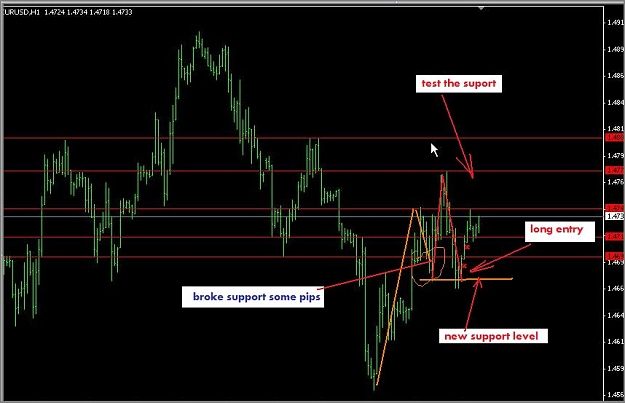
no answer by now, i show you the way i see this chart, but its only me sight, im also new to this thread and i also had some bad trades.
for me, the line you got a short was a support not a res. Why; price came down and broke it a bit, not to much, making new level
.
then after price goes up, it came down again to test the support and failde to break it. So thats a chance to go long, not short
Not a great deal going on on my charts right now apart from a taste on GBPJPY, not feeling so confident about holding on to shorts despite GBP getting a royal whooping across the board. Anyhow, here's a nice looking set-up on [email protected] (120 pips below current) that I'll be looking to get long at. I will survey the majors to see if they correlate closer to the time. Comments welcome of course.
Hi,
I am reading this thread. When I first started learning about trading, I read that to contruct a horizontal support/resistance line you need atleast two points from which price has bounced up/down and that line has not been broken between the two points. In this thread I have seen many charts where price has broken the support/resistance line so many times but that line is still used as a level we expect price to bounce. And in some charts I see support/resistance lines being made using just one bounce. Im a bit confused on how support/resistance lines should be constructed? can Billy or someone successfully using this method for a while please define it for me. Thank you.
Ignored
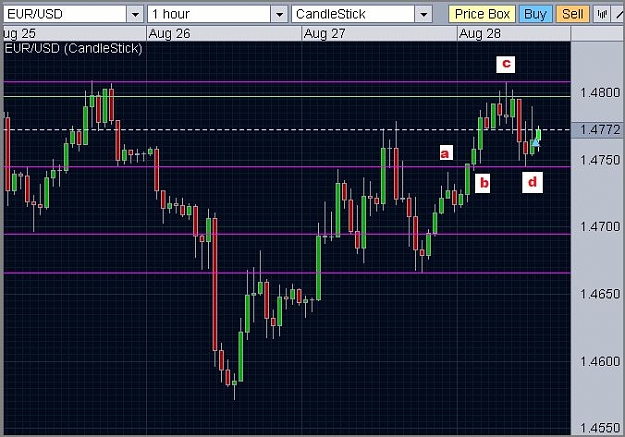
a picture .... more than 10000 words
a) Res
b) gone thru Res
c) Res
d) Res from a) becomes Sup
hi, i went short where price hit resistance at places marked with x with stop loss of 20 pips. i stopped out both times. did i make a mistake somewhere? did anyone lose money too?
Ignored
The reason i wasnt going short with the Eur/Usd was it was forming higher higher and lows through that 1 hour chart, and was bouncing of support from those highs (chart below). I made some good pips trading those bounces and was out when we hit 1.4800 as it had some good reasons for strong resistance (chart 2 below). Once we hit this area with fell some 40 pips quite quickly.
When you are identifing S and R remember the longer time frames hold more value then short with your lines. Having too many lines on an hourly chart will get you in trouble and will probably have you scalping more than taking a good entry and having it run. However it is good to see you keep the same approach with your risk. 20 pips is hard to swallow at times, but get a trade right and you can easily eclipse 100+ pips.
GBPJPY: I like long at 198.05-15 which was support in April and resistance in 2006. It's also on the 76 fib from the last major wave up. Maybe it will get down there....
|
Joined Apr 2008
|
Status: Just a small pip in a large market
|215 Posts
If we break through this short term resistance at 1.4800 i think the next shorting oppurtunity will be at 1.4911-1.4920. If has multiple touches and is the 76.4 retrace on the total down move from 1.6000. Chart below as usual
GBPJPY: I like long at 198.05-15 which was support in April and resistance in 2006. It's also on the 76 fib from the last major wave up. Maybe it will get down there....
Comments anyone?
Ignored
It was an intermediate swing low and made a double bottom there (198.07) in April, but I'm not seeing this level being particularly respected before then.
EURCHF long 1.6113 sl 1.6050 tp 1.6198
Support there + last couple of days eur have more positive news background then chf
Grath 198 is good april sup in my opinion, but in 2006 GY was > 200 all year, and in 2005 it wasnt clear sup/res level (or i cant see it ), i guess trade with medium-sized tp (50 or so) should be in place here, something like long 198 tp 198.5 sl 197.70
(sorry birdt, didnt saw your post)
Just a minor dispute here, the Fibonacci retracement ratio that is mentioned in the pdf and BRV's first postings is listed as 76.4%. However, although this is 100 - 23.6% (the ratio of dividing a number in the fibo series by the number three placesd to the right), the fibo ratio more commonly used is 78.6% (the square root of 0.618). They're fairly close anyway but if we are going to use the tool we may as well use it as precisely as possible.
Can you explain how this pattern actually works.. Thanks
Ignored
It's pretty easy - I post a chart from yesterday because today wasn't a good day to trade cups so far (tight ranging before news and then strong momentum).
Basically you are looking for a pattern on the 5 minute chart (BRV uses the 15 minute) that looks like a cup in an uptrend or like a cup upside down in a downtrend. You mark the bottom of the cup with the horizontal line. The next time price gets there you have a decent chance of a bounce. In my experience they are good for one or max two bounces - the next time that level is seen price will pass through.
Take great care however. You have to gauge current momentum. The cups work best in a quiet market - when news or large orders (read the tape) come into play these levels will most likely break.
no answer by now, i show you the way i see this chart, but its only me sight, im also new to this thread and i also had some bad trades.
for me, the line you got a short was a support not a res. Why; price came down and broke it a bit, not to much, making new level
.
then after price goes up, it came down again to test the support and failde to break it. So thats a chance to go long, not short
Ignored
Thanks for answering. I took the short there because price was below the 200sma, so i thought the trend was down and previously price reacted at that level so i treated it like a resistance. I think in ranging times, its diffcult to tell. maybe next time i'll jsut go for the ones that look like support/resistance from miles away.
The reason i wasnt going short with the Eur/Usd was it was forming higher higher and lows through that 1 hour chart, and was bouncing of support from those highs (chart below). I made some good pips trading those bounces and was out when we hit 1.4800 as it had some good reasons for strong resistance (chart 2 below). Once we hit this area with fell some 40 pips quite quickly.
When you are identifing S and R remember the longer time frames hold more value then short with your lines. Having too many lines on an hourly chart will get you in trouble and will probably have you scalping more than taking a good entry and having it run. However it is good to see you keep the same approach with your risk. 20 pips is hard to swallow at times, but get a trade right and you can easily eclipse 100+ pips.
Ignored
Thanks. Yh, I try to keep stop loss and tp to ratio 1;3. I think it might be a good idea to see if a level is s/r on more than one timeframe then take it if it is.
Thanks for answering. I took the short there because price was below the 200sma, so i thought the trend was down and previously price reacted at that level so i treated it like a resistance. I think in ranging times, its diffcult to tell. maybe next time i'll jsut go for the ones that look like support/resistance from miles away.
Ignored
It also depends on the time frame that you are using the SMA. I use EMAs as they also do offer entry points when I scalp however that is a different thread, but the same rules apply. The longer the time frame the stronger the SMAs will be especially if they coincide with S and R, Fibs ect.