Do anyone of you guys have a good trailing technique? I think this is the hard part
Ignored
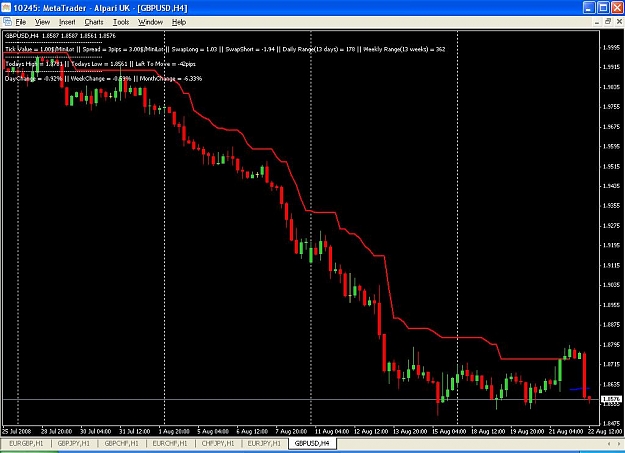
If you are looking to get into a long trend (like the one we had the past month when the USD was going all out attack) I think you need to be generous on the sl. By that I mean you want the sl to be 1.5->2*ADR (average daily range) away from where price is now, so the easiest way to do it is to put a trailstop which is equal to 1.5->2*ADR. This will give price room to move against you a little before continuing along the trend.
ADR is different for each pair, and it measures the pair volatility. The ADR for USDJPY is around 110 pips so here a trailstop of 160-220 pips will do. GBPJPY on the other had has an ADR of around 250 pips, and for that you'll need a trailstop of about 370-500 pips.
You can use the attached indicator and this shows where to put sl which is based on what I've described above. You have to determine how many times the ADR you want to be using by changing the Coefficient parameter. The ATR parameter is to determine how many days the average should be based on, 20 days should be good. For this indicator you have to determine on which timeframe you want to trail on as it looks different on each timeframe. Personally I think H4 is good.
As you can see from the chart, had you had a trade from around 1.98 and kept it you would have closed it yesterday at around 1.87, not bad considering you could have added trades along the way.
Here's my way of doing it:
1) First of all I look for a free trade, preferebly for 1/2 of the position but sometimes only 1/3 of the position will remain after BE point
2) The remaining part is left to ride until the price comes to a s/r area and stalls for a longer time or starts reversing (based on the intraday movement). When I see the reversal (I look at lower timerframes for this) I exit more than half of the remaning position and the last part is left at initial sl. This way I've realised a win on this trade even if the rest gets stopped out, and I have left about 10-20% of the original trade to run.
3) The remaning postion's sl is moved only after I see that there's an s/r area between the entry price and current price, and the sl will be placed on the opposite side of the s/r area in comparison as to where price is now. A little like Jarroo's chart but on H4 timeframe.
Ignored
Thanks NAL. Great tool to add to the mix.
Now for some back testing of some previous trades . . . .Oh man . . I could have stayed in longer on that one.
Thanks buddy.
Indicators show the past. Price Action "Indicates" the future.
Further thoughts..The GBPUSD daily chart is indicating a bottom. Many traders would have placed buy orders over the last couple of days. This down move today would have cleaned out many stops. I intend to use the DIBS method to enter at the very bottom again. Happy trading.
Ignored
Dangerous thought. For me, the downtrend of the GBP is still intact. Based on the daily chart I wouldn´t look for long entries.
On my chart the IB had the exact same low as the previous bar. A double bottom so to speak. I think thats an even stronger signal. But your observation is correct
Dangerous thought. For me, the downtrend of the GBP is still intact. Based on the daily chart I wouldn´t look for long entries.
Just my 2cents
Ignored
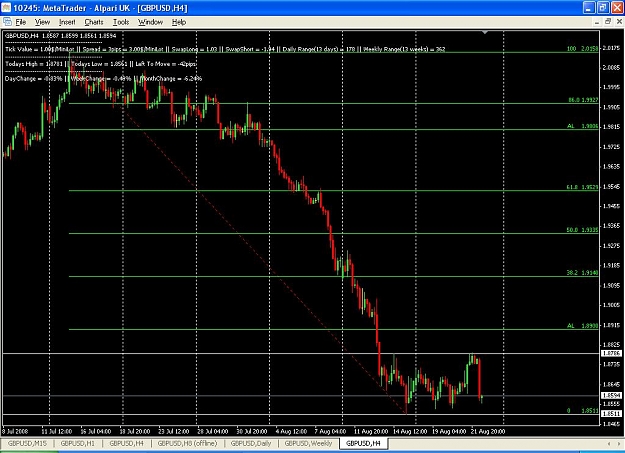
Yeah I agree here with you. For me GU is in a range as seen in the chart between the 2 white lines. Yesterday's high only just went above the high of 14/Aug, only to go down again about 200 pips, for me confirming the range.
If price goes above 1.88 and holds this as support and I would consider long up to the 1.9140-area which is a big s/r level and conveniently the 38% fib of this downmove as well.
If you are looking to get into a long trend (like the one we had the past month when the USD was going all out attack) I think you need to be generous on the sl. By that I mean you want the sl to be 1.5->2*ADR (average daily range) away from where price is now, so the easiest way to do it is to put a trailstop which is equal to 1.5->2*ADR. This will give price room to move against you a little before continuing along the trend.
ADR is different for each pair, and it measures the pair volatility. The ADR for USDJPY is around 110 pips so here a trailstop of 160-220 pips will do. GBPJPY on the other had has an ADR of around 250 pips, and for that you'll need a trailstop of about 370-500 pips.
You can use the attached indicator and this shows where to put sl which is based on what I've described above. You have to determine how many times the ADR you want to be using by changing the Coefficient parameter. The ATR parameter is to determine how many days the average should be based on, 20 days should be good. For this indicator you have to determine on which timeframe you want to trail on as it looks different on each timeframe. Personally I think H4 is good.
As you can see from the chart, had you had a trade from around 1.98 and kept it you would have closed it yesterday at around 1.87, not bad considering you could have added trades along the way.
Here's my way of doing it:
1) First of all I look for a free trade, preferebly for 1/2 of the position but sometimes only 1/3 of the position will remain after BE point
2) The remaining part is left to ride until the price comes to a s/r area and stalls for a longer time or starts reversing (based on the intraday movement). When I see the reversal (I look at lower timerframes for this) I exit more than half of the remaning position and the last part is left at initial sl. This way I've realised a win on this trade even if the rest gets stopped out, and I have left about 10-20% of the original trade to run.
3) The remaning postion's sl is moved only after I see that there's an s/r area between the entry price and current price, and the sl will be placed on the opposite side of the s/r area in comparison as to where price is now. A little like Jarroo's chart but on H4 timeframe.
Ignored
Thanks mate! Thats some usefull information for a rookie like me Im gonna take a look at it.
Yeah I agree here with you. For me GU is in a range as seen in the chart between the 2 white lines. Yesterday's high only just went above the high of 14/Aug, only to go down again about 200 pips, for me confirming the range.
If price goes above 1.88 and holds this as support and I would consider long up to the 1.9140-area which is a big s/r level and conveniently the 38% fib of this downmove as well.
Now for some back testing of some previous trades . . . .Oh man . . I could have stayed in longer on that one.
Thanks buddy.
Ignored
Just an update on how I've managed yesterday's two trades on UJ.
1st trade
Risked 1% on 15 pips sl. Took first half off at 30 pips profit because of the speed of the break. Took another 30% of at just above 109.00 for 54 pips, and then took 10% off at 108.40 for 114 pips and left 10% and original sl.
This gives me a win on this trade for a minimum of: (0.5*30 + 0.3*50 + 0.1*114 - 0.1*15) / 15 = 2.66%. At the moment (price is at 109.30) the trade is at: (0.5*30 + 0.3*50 + 0.1*114 + 0.1*24) / 15 = 2.92%
2nd trade
Risked 0.5% on 28 pips sl. Took 2/3 (67%) off at 14 pips, took another 23% at 108.40 for 23 pips and the rest was stopped out at for 10% at 28 pips. This gives: (0.67*14 + 0.23*23 - 0.1*28) / 28 = 0.21%.
Total outcome of this trade if the remaining part of the 1st trade is stopped out is 2.87% which isn't bad for one days work. As you can see I'm not interested in how many pips I've won on a trade, I'm only interested in the %.
Now imagine we get into a trend downwards from here and UJ drops to 100.00. This would mean, without adding to this trade, that this trade would have given an increase of about 9.5% to the account. And that is because I left 10% of the original trade. Just imagine if you leave 20% or if you have stacked up 4-5 trades along the way. With just a risk of 1% - how long will it take to double the account?
Go back over the charts over the past USD run and see if you can come up with a way of trailing your stops while locking in some profits and adding along the way. Find something that you feel would suit you. This I know suits my style of trading. But we are all different.
Haha, I don't know myself. When I first learned about fibs here on FF some guys used AL instead of the 23% and 76% fib levels, and so I never bothered changing it. I think it stands for Alert, but it doesn't really matter.
Took 2/3 (67%) off at 14 pips, took another 23% at 108.40 for 23 pips and the rest was stopped out at for 10% at 28 pips. This gives: (0.67*14 + 0.23*23 - 0.1*28) / 28 = 0.21%.
Ignored
NAL, great analysis, thank you very much for sharing it. I have a few ?s:
Why did you change the risk amount for the 2nd trade? General thinking seems to be: "If you are not about an IB, why trade it at all." To me that means that all traded IBs are to be viewed as being equal.
Also, how why did you took 2/3 of the position at 2:1 R/R level?
I guess you had doubts about that trade to start with...
Ignored
Here's the trade and why I took it as I did: http://www.forexfactory.com/showpost...postcount=5027
My risk is always 0.5->1%. If the trade comes early in the day and there hasn't been a big move in the ADR I will risk 1% because there's higher probability that the move to be good, if there's already been a move (in the case of the UJ trade the ADR was overrun, but the IB was in good position and price action was good as well) I will risk 0.5%.
If you have a trigger on an inside bar and it's stopped out for a loss, do you look for the next inside bar? Or do you take the opposite trade if the rules still apply?
If you have a trigger on an inside bar and it's stopped out for a loss, do you look for the next inside bar? Or do you take the opposite trade if the rules still apply?
Ignored
If it still applies to the rules, you take the opposite side.
Indicators show the past. Price Action "Indicates" the future.
Just an update on how I've managed yesterday's two trades on UJ.
1st trade
Risked 1% on 15 pips sl. Took first half off at 30 pips profit because of the speed of the break. Took another 30% of at just above 109.00 for 54 pips, and then took 10% off at 108.40 for 114 pips and left 10% and original sl.
This gives me a win on this trade for a minimum of: (0.5*30 + 0.3*50 + 0.1*114 - 0.1*15) / 15 = 2.66%. At the moment (price is at 109.30) the trade is at: (0.5*30 + 0.3*50 + 0.1*114 + 0.1*24) / 15 = 2.92%
2nd trade
Risked 0.5% on 28 pips sl. Took 2/3 (67%) off at 14 pips, took another 23% at 108.40 for 23 pips and the rest was stopped out at for 10% at 28 pips. This gives: (0.67*14 + 0.23*23 - 0.1*28) / 28 = 0.21%.
Total outcome of this trade if the remaining part of the 1st trade is stopped out is 2.87% which isn't bad for one days work. As you can see I'm not interested in how many pips I've won on a trade, I'm only interested in the %.
Now imagine we get into a trend downwards from here and UJ drops to 100.00. This would mean, without adding to this trade, that this trade would have given an increase of about 9.5% to the account. And that is because I left 10% of the original trade. Just imagine if you leave 20% or if you have stacked up 4-5 trades along the way. With just a risk of 1% - how long will it take to double the account?
Go back over the charts over the past USD run and see if you can come up with a way of trailing your stops while locking in some profits and adding along the way. Find something that you feel would suit you. This I know suits my style of trading. But we are all different.
Ignored
This is exactly the way people should be seeing things and working things out with this method and all methods.
"Even if you fall down face first, you still went forward."