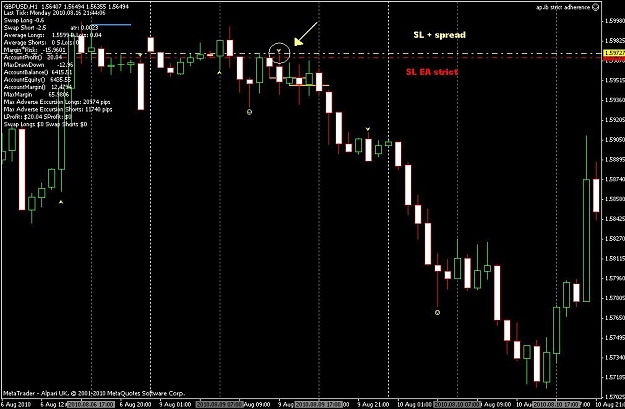
As discussed at "The DIBS Method . . . No Free Lunch continues", following the rules of the method from the first post, attached is my rendition of the system in MT4 EA form.
After back testing several variations, I am concluding there must be a considerable amount of trader discretion to make this method profitable. Strict adherence to the rules makes this method a definite loser over the long term.
To (over)optimize the EA for each currency pair will lead to disaster, because fitting the system to historic price action does not make a system profitable over the long term.
I'm interested in reading other opinions, if there are any...
Attached File(s)