Excellant thread. GBP has broken the green merdian and approaches the red meridian again. the daily bars have touched the black merdian 9 of the last 10 days.
Ignored
Oh Lord. That chart is an excellent example of putting too much crap on your screen because you need extra extra EXTRA confirmation that you're right...
Excellant thread. GBP has broken the green merdian and approaches the red meridian again. the daily bars have touched the black merdian 9 of the last 10 days.
Ignored
I have used those "Forks" in the past. They had some good corrollations.
How long have you been using them?
I have been working with forks for over 25 years. I find them a valuable tool. I expect that often, your channels will be very similar to the indications of the fork.
I attach a closer view of the black fork on yesterdays chart.
For our unprofitable friend Mr Trend. I would suggest that traders that are not profitable yet, take advantage of the ideas and help available in these forums.
Ask questions and try new ideas, to see what works for you. I think your time can be better spent, than "crapping" on other contributors.
Ignored
Sorry if you were offended, but if you are indeed profitable and have been at this for awhile, you know why I said that when a poster who has 1 post posts that much on a chart on a forum.
This may be a dumb question but is there any reading a trader can find using the fork channel? I am intrigued with this versus my short term trend lines. Thanks in advance.
This may be a dumb question but is there any reading a trader can find using the fork channel? I am intrigued with this versus my short term trend lines. Thanks in advance.
|
Joined Jul 2006
|
Status: Pay the man ! !
|912 Posts
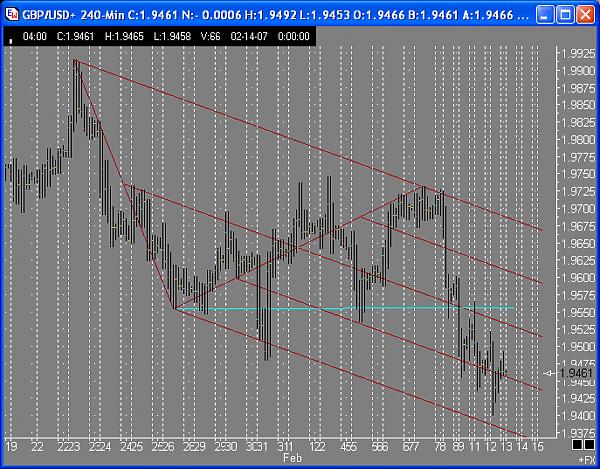
Here is an update of the GBP/USD chart we have been looking at. The pound has extended out of its 200 pip comfort range of 1.9550 to 1.9750 down to the 1.9400 area. The pound has been weakening since the end of last week but the dollar conitinued to weaken at the european session sending the pair back above 1.9500. If the dollar continues to weaken, it could find the GBP/USD back in its comfort range. This could happen fast as, so far, cupid has not arranged any love for the dollar today.
|
Joined Jul 2006
|
Status: Pay the man ! !
|912 Posts
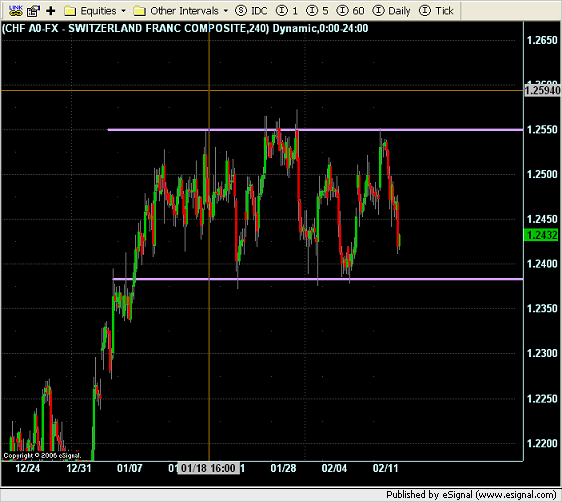
While the Eur/USD broke out of it's range on the long end, the USD/CHF has not broken the 1.2380 area floor. Though I must consider looking at EUR/USD longs due to its close above 1.3060, there is still some doubt in regards to a new dollar weakness trend with the USD/CHF still in its range.
|
Joined Jul 2006
|
Status: Pay the man ! !
|912 Posts
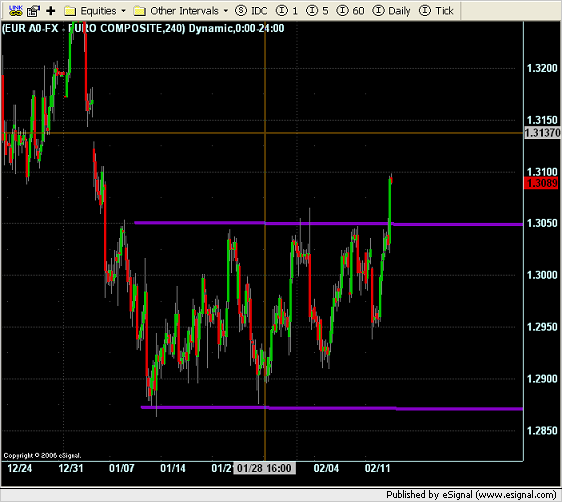
Here is an updated chart of the Eur/Usd we have been watching. It has broken out of the 200 pip range it has been in since early January. Straight technical analysis has us looking to long pull backs. Fundementally we have Ben Bernancke addressing congress this week. There is the thought that he may fuel further longs. We will also be viewing the new post holiday economic data this week and next which has the potential to fuel the move as well.
|
Joined Jul 2006
|
Status: Pay the man ! !
|912 Posts
Here is an update of our 4hr eur/usd chart break out. As I talked about in the last chart, the euro has been in this range since about the first week of January. So far the eur/usd has held these gains. The usd/jpy and chf/usd has follow suit breaking out short. This completes the picture of new dollar weakness and is technical justification for the hold of US dollar swing shorts.
|
Joined Jul 2006
|
Status: Pay the man ! !
|912 Posts
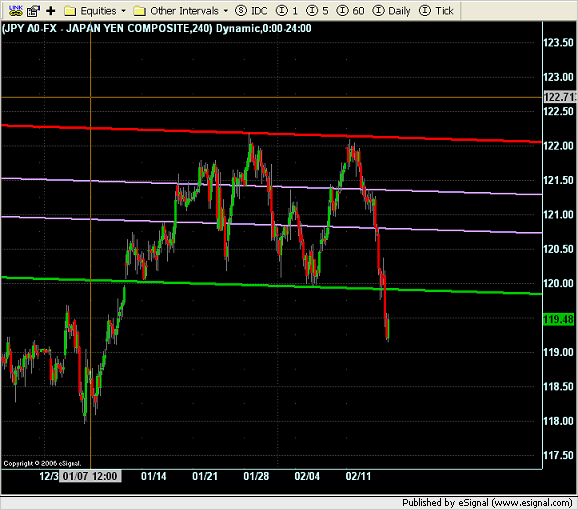
Here is a chart of the usd/jpy. Like the eur and franc dollar crosses, the yen vs the dollar has been in a trading range since early January. Most beleive the strengthening of the Yen is overdue but it is likely just an adjustment by the interest chasing carry traders. Nonetheless, techinically this adds to the negative dollar sentiment argument as a valid short swing trade.
|
Joined Jul 2006
|
Status: Pay the man ! !
|912 Posts
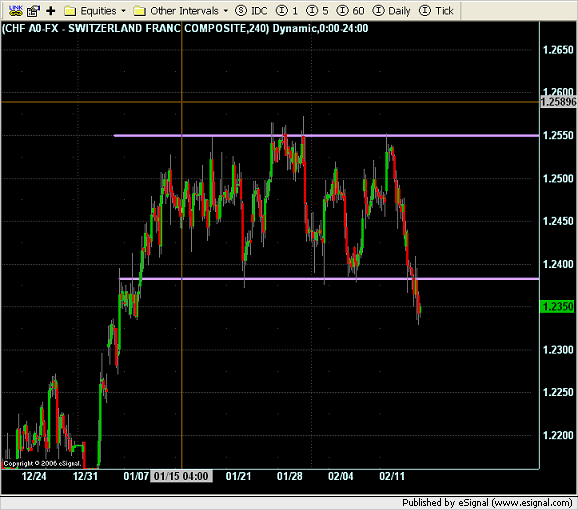
Here is a chart depicting the usd/chf breaking out short. This is the final peice of the global US dollar picture for me. I like this pair as an idicator for the USD because the Suisse Franc is a pretty stable currency. Unlike the Euro, Yen and Pound, it is not influenced by the cyclical carry trade adjustments.
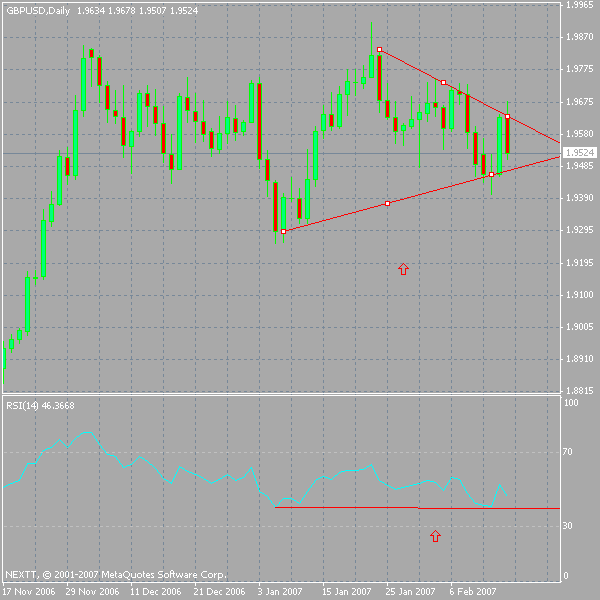
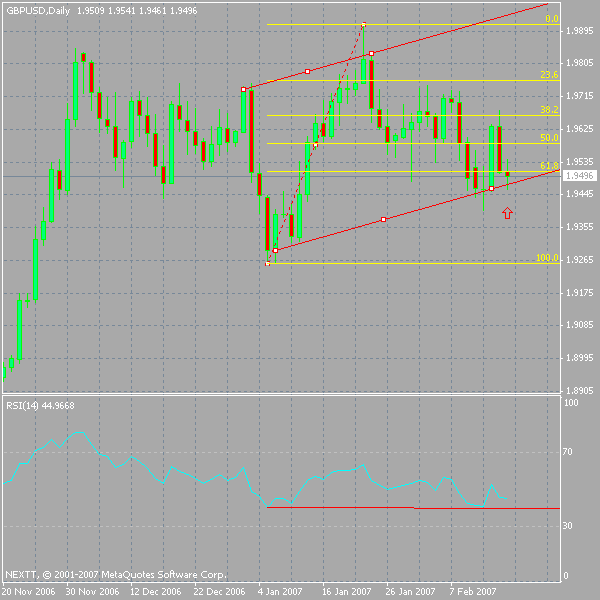
in the chart we can see a divergence which as i understand means rising wave in the cable.
what do you guys think.
Ignored
Your analysis certainly matches my above 3 charts depicting a weakening dollar. However, the GBP/USD is most difficult to analize technically right now because it is weakening too due to bad data and the subsequent bail out of carry traders of the GBP/JPY. While the pound is the daily range champion of the big 4 dollar crosses, it would be the most unpredictable directional trade at the moment in my opinion. AT this point I would be reluctant to long the pound until it closed solidly above 1.9540. Until then, it is the only one of the four major dollar crosses that I see a short bias. What happens next for the pound will be dependant on not only the dollar sentiment but the point at which the carry traders jump back on the yen shorts.
Your analysis certainly matches my above 3 charts depicting a weakening dollar. However, the GBP/USD is most difficult to analize technically right now because it is weakening too due to bad data and the subsequent bail out of carry traders of the GBP/JPY. While the pound is the daily range champion of the big 4 dollar crosses, it would be the most unpredictable directional trade at the moment in my opinion. AT this point I would be reluctant to long the pound until it closed solidly above 1.9540. Until then, it is the only one of the four major dollar crosses that I see a short bias. What happens next for the pound will be dependant on not only the dollar sentiment but the point at which the carry traders jump back on the yen shorts.
Ignored
ok
but in the chart we can identify a bullish channel and divergence, in addition
the last bar did not break the lower tl i expect a move upwards next week
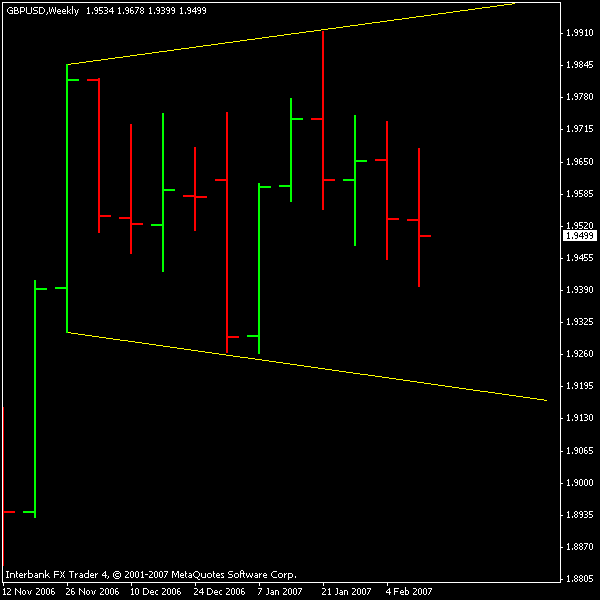
lower highs, lower lows on a weekly chart with an expanding triangle.......err, bias is south, yet expect volatility and nothing defined yet!
Ignored
Great observation on the expanding triangle ghitz. Most people dont notice them and as you stated they often preclude a big move.
While it is early yet on sunday, my charts are showing an upward gap in the pound to 1.9550. This puts the pound above the 1.9540 level that I had mentioned and matches mosheber's bullish divergence. The other 3 of the big 4 have gapped gaining strength against the dollar as well.
|
Joined Jul 2006
|
Status: Pay the man ! !
|912 Posts
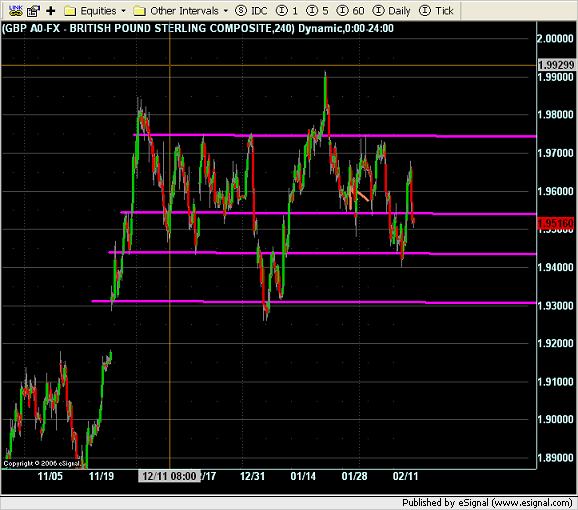
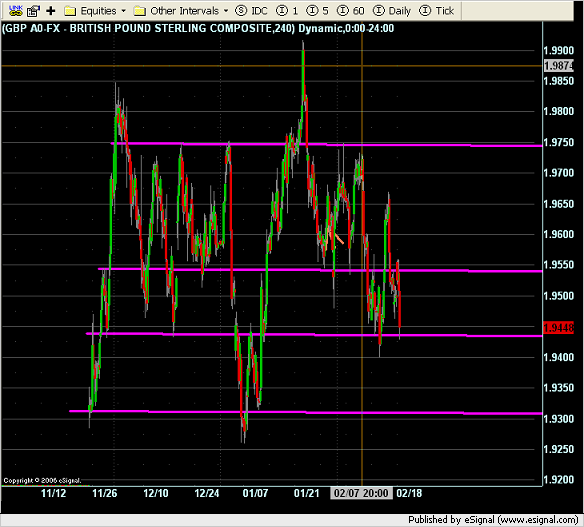
Here is an updated GBP/USD chart showing the horizontal price channels I have been watching on the pound. The pound/US dollar cross has fallen down to the 1.9440 support line. with the U S dollar going sideways so far today, it is easy to see the Pound sentiment is still down. This chart suggests that if 1.9440 fails,1.9300 will be the next support.
Great observation on the expanding triangle ghitz. Most people dont notice them and as you stated they often preclude a big move.
While it is early yet on sunday, my charts are showing an upward gap in the pound to 1.9550. This puts the pound above the 1.9540 level that I had mentioned and matches mosheber's bullish divergence. The other 3 of the big 4 have gapped gaining strength against the dollar as well.
Ignored
thanks FX
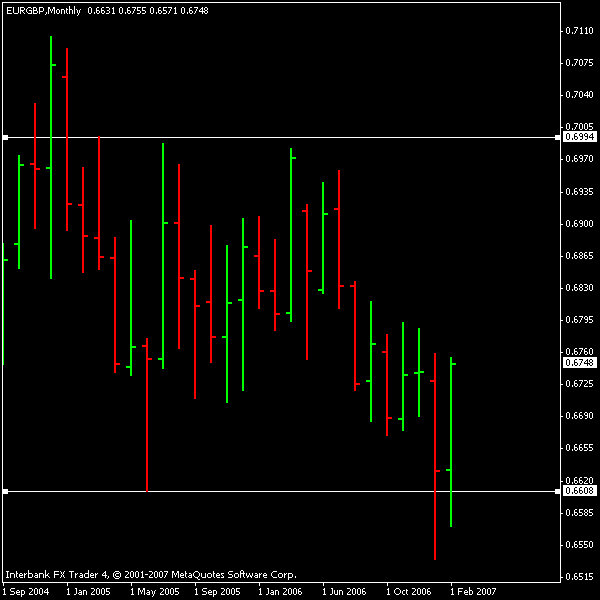
EURGBP breaks back into its long term range. Question is if it will try and visit the high of the range.
Monitor this pair closely. It will most likely give Cable's directional bias (opposite direction to it). if there is a Sterling trade weighted index, EURGBP would take about 50% or more of the weight.
g
Attached Image
With a break always expect a pullback, otherwise, you're dead meat/
Here is an updated GBP/USD chart showing the horizontal price channels I have been watching on the pound. The pound/US dollar cross has fallen down to the 1.9440 support line. with the U S dollar going sideways so far today, it is easy to see the Pound sentiment is still down. This chart suggests that if 1.9440 fails,1.9300 will be the next support.
Ignored
Looks like we had a nice reaction to 1.9440. We are now hovering around the 1.9550 support/resistance area. The BOJ interest rate decision/statement tonight and the U.S. CPI will be shaping the market and giving the pound direction.