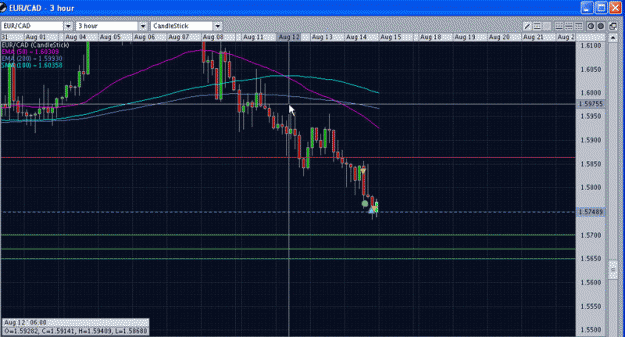
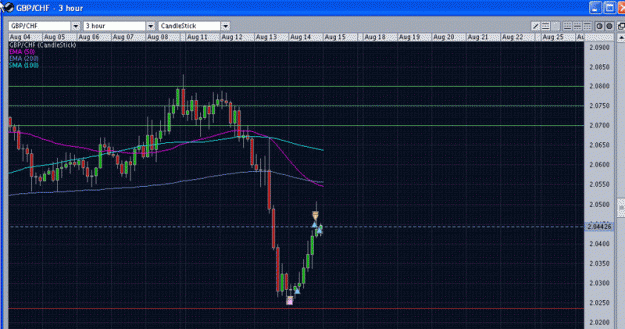
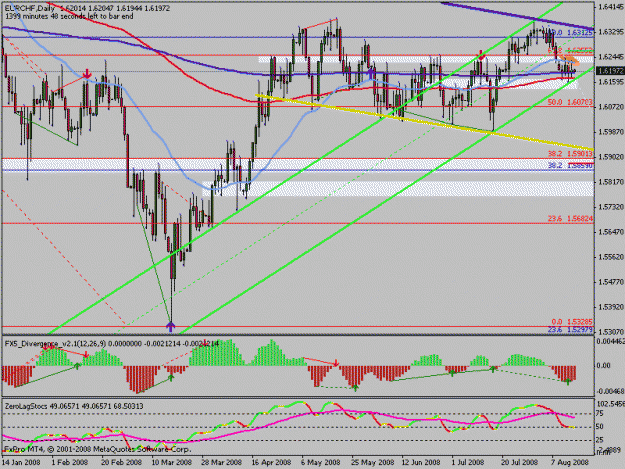
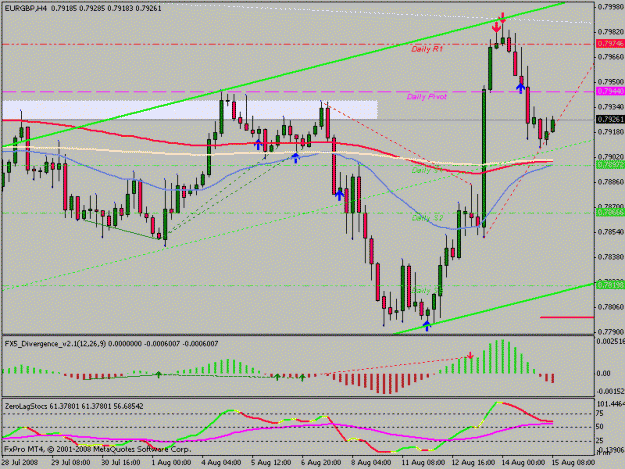
maybe maybe we will see 165.30 for EJ and also 207.50 for GJ and 99.10 for AUDYEN but i cannot see still a confirmation for a retrance(up trend) only i see a hammer
Ignored
Can y0u plz tell me what confirmation were you w8ting for t0 confirm the EJ daily hammer to go long?
Can y0u plz p0st a chart of the EJ daily i have n0 access to my pc right n0w
Thank y0u
today/tonight i have no special charts with explanation for you.
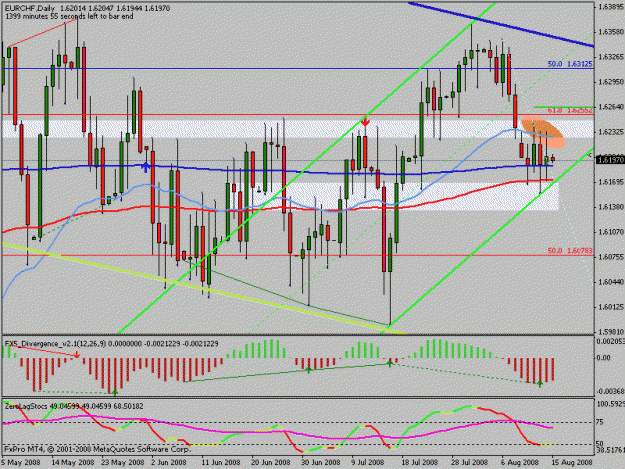
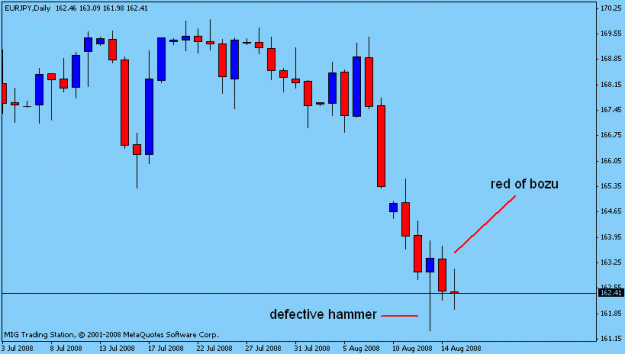
what we clearly see, is, that the hammer we saw last days on yen crosses,
have all failed. We see instead a lot of bearish engulfing candles.
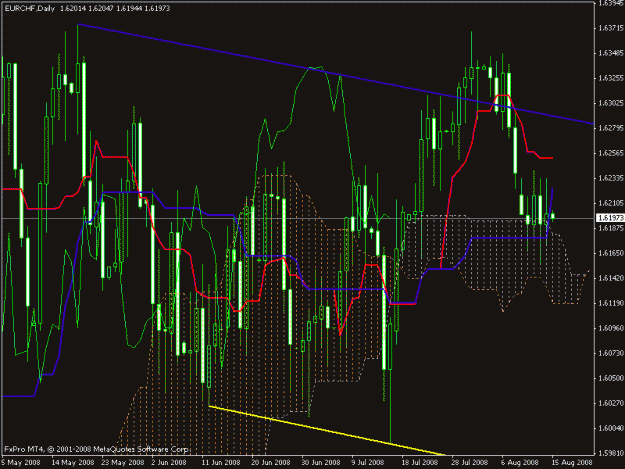
As an example here a chart from gold. Todays candle embraces
last days bullish engulfing candle. But bears are almighty, they take
control and send gold down again.
next charts are about SL and TP. Green is TP, red is SL. I have to work on this
Can y0u plz tell me what confirmation were you w8ting for t0 confirm the EJ daily hammer to go long?
Can y0u plz p0st a chart of the EJ daily i have n0 access to my pc right n0w
Thank y0u
Ignored
after a hammer i must see a blue opening marubozu or blue closing marubozu or blue marubozu or even a blue of bozu.
but we have seen after hammer (daily) a red of bozu .
attention :hammer previous day failed
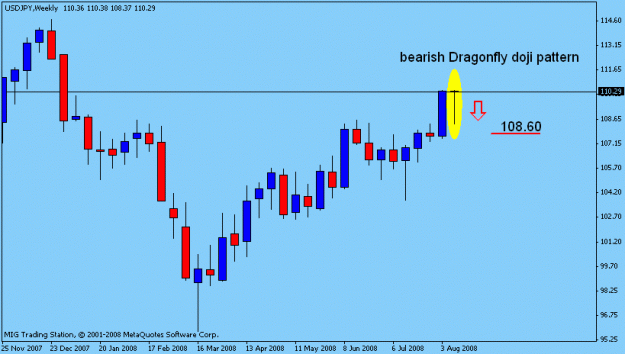
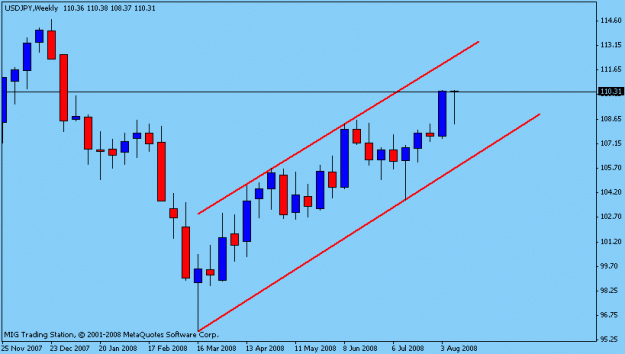
also attention yo weekly candle chart we can see a weekly bearish pattern !
on the other hand we can see a channel uptrend .
if we have this rate(110.26) for close weekly USDYEN .I will be in bear camp in the next week .