Joined Sep 2006
|
Status: Son of this Sceptred Isle.
|3,635 Posts
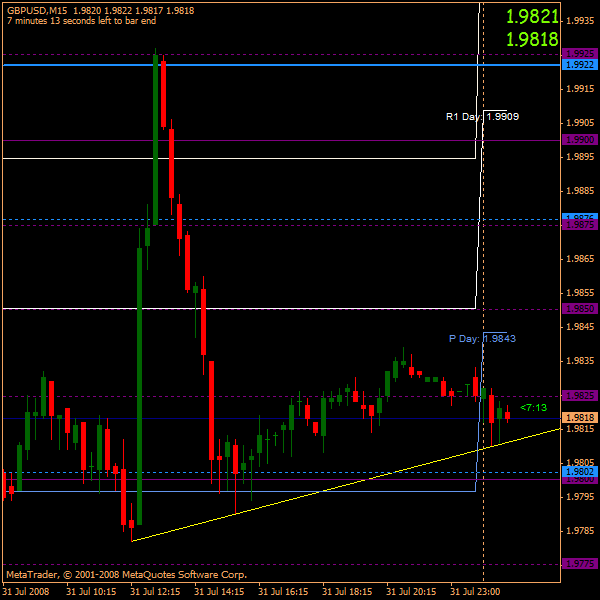
Well, as you can see, price dropped through the TL before meeting the confluence of the midpoint line and the .00 psych line. It then headed north and tested the .25 psych line numerous times before meeting another confluence of TL and .25 psych line (note the shooting star candlestick right there) and this time dropping firmly south. As I type this, price has started to reverse at 1.9781, which has turned out to be a support line from a few days ago. Mind you, there's still around 10 minutes to go before the next candle, so let's see what happens.
Joined Sep 2006
|
Status: Son of this Sceptred Isle.
|3,635 Posts
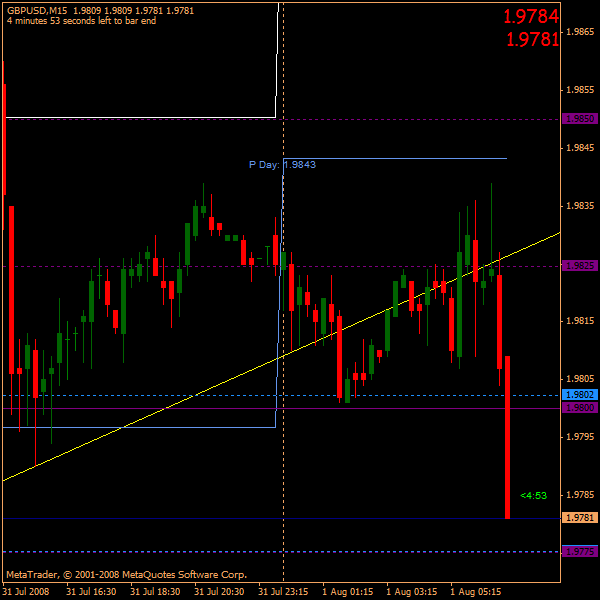
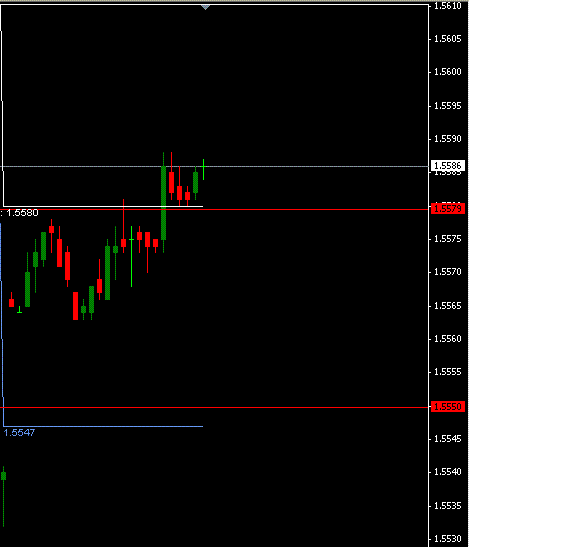
Eur/usd ranging since midnight between .75 and .50, BELOW the Pivot Point. So any break below .50 might be worth taking, except for the close proximity of the S1 line. Also, it's NFP day today, so caution is required!
Joined Sep 2006
|
Status: Son of this Sceptred Isle.
|3,635 Posts
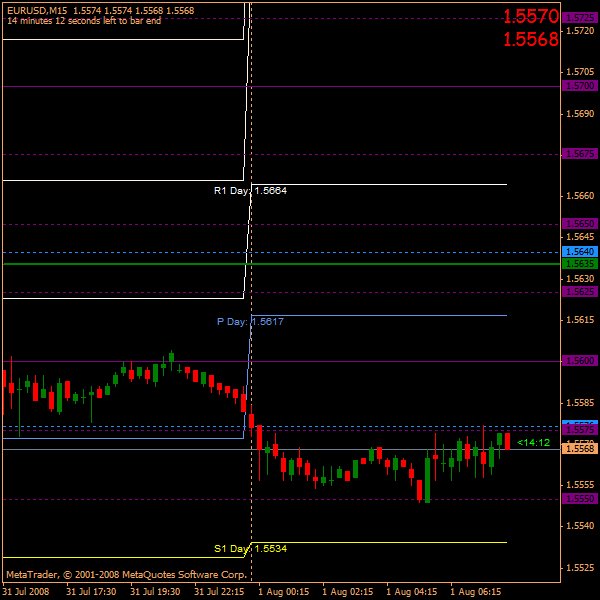
Gbp/usd about and hour and a quarter on. See how price punched right down to the .50 psych line, and how a large hammer candlestick formed, signifying a possible reversal. Price then reversed up the Monthly Pivot Point (green line), and looks to be a little stalled between there and the S1 line right now. Is this a possible trading situation? IMO, no, not until it clears the .50 line. But that's just my opinion.
Joined Sep 2006
|
Status: Son of this Sceptred Isle.
|3,635 Posts
Thanks for your comments, mate.
Last week, I didn't have a lot of time to trade, but I still ended the week in profit. My domestic circumstances don't allow me to trade fully uninterrupted, so I have to grab the chances as and when time allows.
The more I look into this method, the more obvious it becomes that the vast majority of indicators are a waste of time. This method of yours more or less "forces" you to LOOK at what's going on with the PA, instead of relying on what the indicators are doing. (The only indicator I would use is a stochastic, and even then as a possible filter.) Also, I'm taking more notice of candlestick patterns now, especially around the pivot and psych lines, and after watching your videos, looking to add the odd TL as and when the situation demands it. Pivot points, psych points and fibs just seem to do the business all the time
Speaking of your videos, mate, whenever I try and open the November one, I get "Cannot open file. It does not appear to be a valid archive." No problems with October and December ones, mate, but the November one is a no-go.
Joined Sep 2006
|
Status: Son of this Sceptred Isle.
|3,635 Posts
Morning, folks..
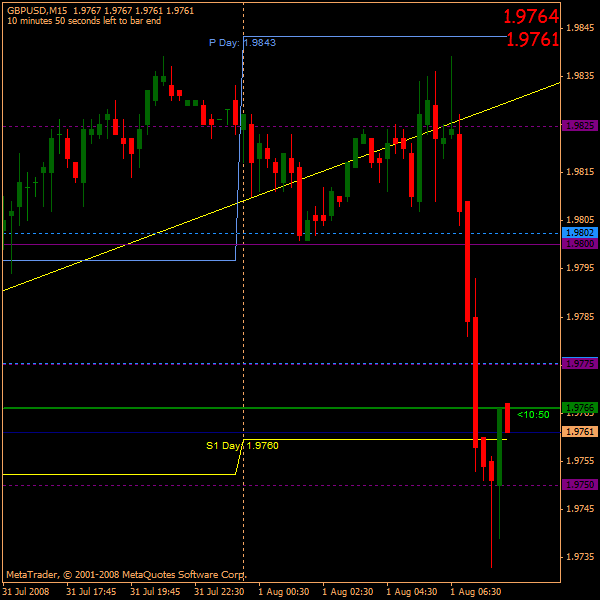
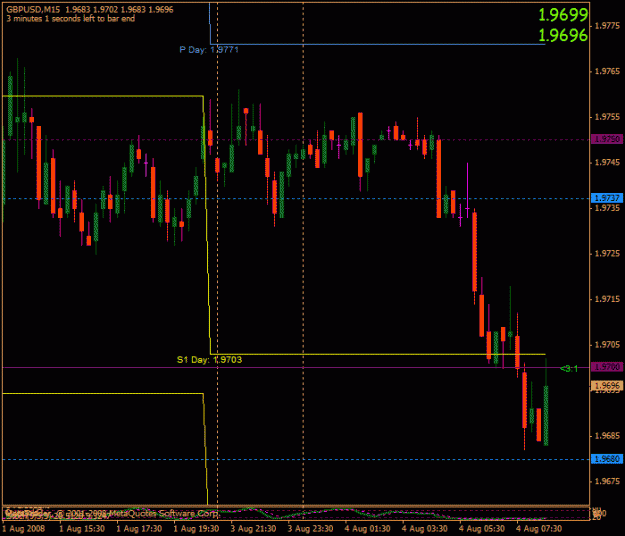
Cable started off the day by ranging approx between psych line 1.9750 and mid-point line 1.9737. I was still in the Land of Nod when price started dropping towards S1. Note the two magenta dojis. The second one tells us that, although undecided, price is starting to look quite bearish, and so it proves. The confluence of S1 and psych line 1.9700 provides an ideal consolidation zone, before price drops towards the next mid-point at 1.9680, but doesn't quite make it. Does that mean price will start to move up again? As I type this, price is again consolidating, so we'll have to wait and see. With price being below the Main Pivot Point, I'm only interested in going short, so I'll wait to see if it breaches the 1.9680 line.
Looking at your trade, I've just inserted a Mid-Point line, and just look at the beautiful bounce at the first arrow, followed by another at the second arrow. The third shows how price used the MP line as a consolidation area.
Looking at your trade, I've just inserted a Mid-Point line, and just look at the beautiful bounce at the first arrow, followed by another at the second arrow. The third shows how price used the MP line as a consolidation area.
Lovely trade, mate.
Ignored
Nicely done.
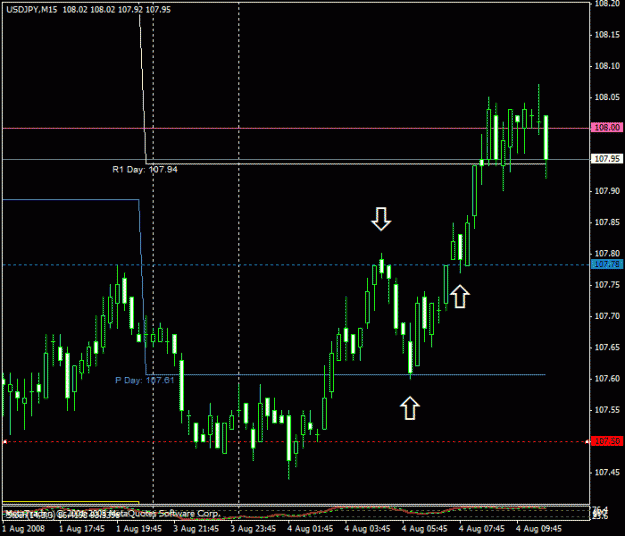
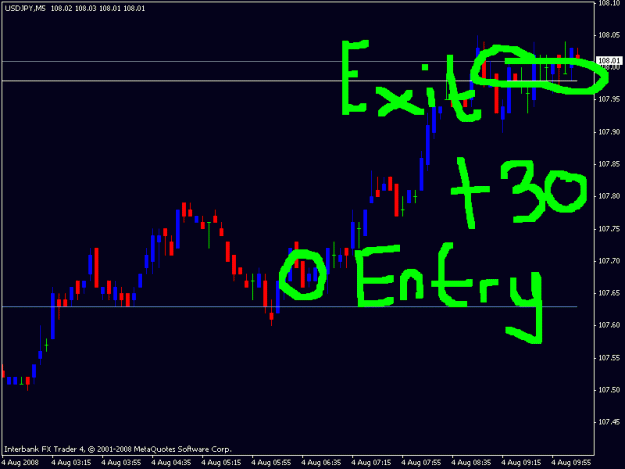
Price touches the PP then begins to move up.
It hits 80 psych level - pulls back (that's my entry) then moves nicely up to the next 00 level.
Joined Sep 2006
|
Status: Son of this Sceptred Isle.
|3,635 Posts
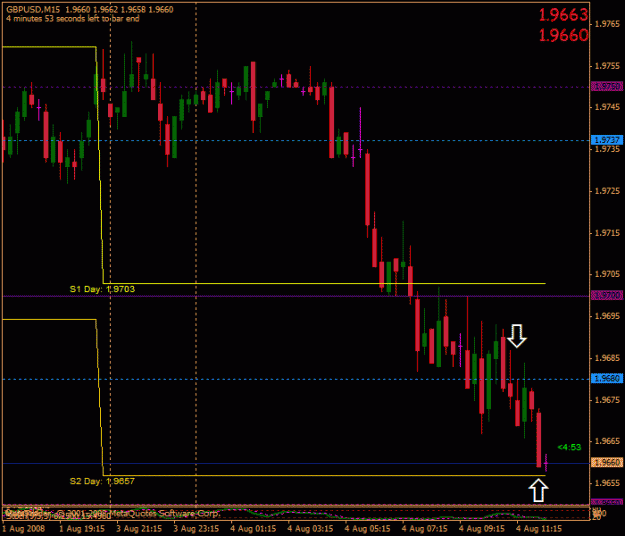
Well, Cable finally decided to give me a little encouragement. It teased me a lot as it danced around the 1.9680 mid-point line, but it finally gave me my entry as indicated by the first arrow. Target was always going to be S2, and I jumped ship just above it, clinching 15 pips. A long wait for what seems to be a minimal reward, but hey, it's better than a losing trade anyday!
Joined Sep 2006
|
Status: Son of this Sceptred Isle.
|3,635 Posts
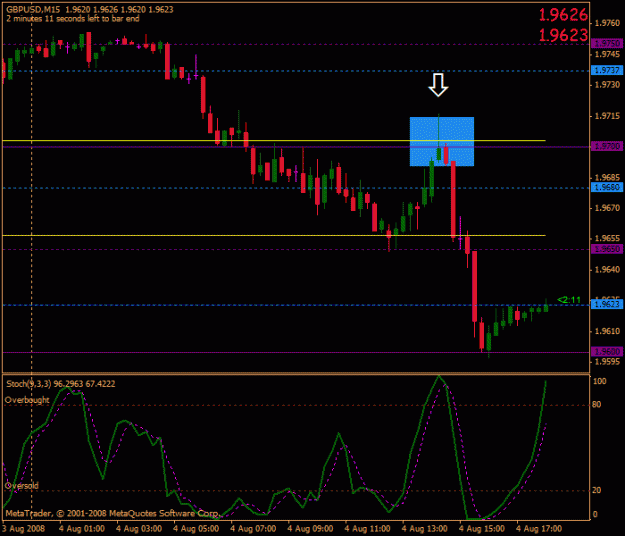
....I'd have put a large bet on this happening. As soon as I have to leave the computer to attend to something else, this happens. Look at that signal in the blue rectangle.
Right on the confluence of S1 and psych line 1.9700, there's what looks like a cross between an inverted hammer and a shooting star, and then a bearish engulfing candle. Look what happens then! An almost unstoppable drop of around 100 pips!
Yeah, pivot points and psych lines don't work, right?