in the monthly candle chart AUDUSD we see a shooting star pattern with a confirmation.im waiting forming a bearish evening star pattern
i see AUSDUSD IN .90XX
Ignored
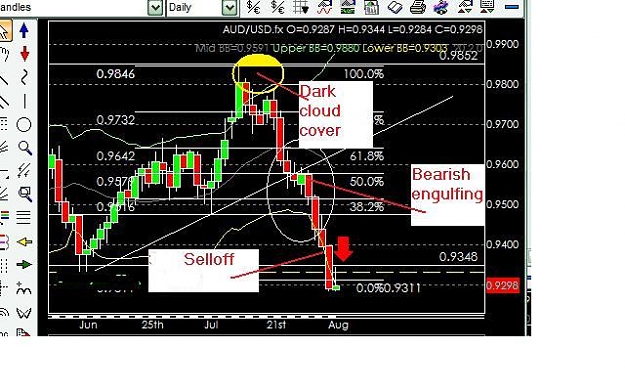
yes,I see more bearish for AU in daily chart.
It can move to 090xx.But consider risk news RBA and Fed rate nextday
Hussin,you can explain for me the reason that attend to Nikkei225??
I usually trade AU with Gold trend relation,don not know Nikkei225.
Thanks u.G day and G trade
in the weekly candle chart USDYEN we can see signs from a reversal by petrifing harami pattern . at least we must see a kabuse pattern or even a bearish engulfing pattern in the next weeks.
attention :this pattern is with medium reliability.
first my target 106.50
Ignored
Hi Hussin,
price is insure where to go, I`am very unsure too for this pair.
I marked the tom demark resistance at 106.30 (which coincidents with 38.3 fibo line), if this breaks we might see the back of the blue trendline.
On the other hand, the bullish tom demak resistance is 113, with matches with 61.8 fibo level.
BUT, what have we seen on geppy at 213.80/214 for weeks ? Testing of resistance. And then a break to 216, it willl be very interesting to see what happens, with all the bullish dollar at the moment to this pair.
Hussin,you can explain for me the reason that attend to Nikkei225??
I usually trade AU with Gold trend relation,don not know Nikkei225.
Thanks u.G day and G trade
Ignored
yes
fall asian stocks =fall currencies high yield (AUD-NZD) and unwind carry treade
price is insure where to go, I`am very unsure too for this pair.
I marked the tom demark resistance at 106.30 (which coincidents with 38.3 fibo line), if this breaks we might see the back of the blue trendline.
On the other hand, the bullish tom demak resistance is 113, with matches with 61.8 fibo level.
BUT, what have we seen on geppy at 213.80/214 for weeks ? Testing of resistance. And then a break to 216, it willl be very interesting to see what happens, with all the bullish dollar at the moment to this pair.
Ignored
peaches im waiting unwind carry treade for GBPYEN -AUDYEN-NZDYEN of course NZDYEN IS PIRCE